Electronic Arts 2006 Annual Report Download - page 136
Download and view the complete annual report
Please find page 136 of the 2006 Electronic Arts annual report below. You can navigate through the pages in the report by either clicking on the pages listed below, or by using the keyword search tool below to find specific information within the annual report.-
 1
1 -
2
-
3
-
4
-
5
-
6
-
7
-
8
-
9
-
10
-
11
-
12
-
13
-
14
-
15
-
16
-
17
-
18
-
19
-
20
-
21
-
22
-
23
-
24
-
25
-
26
-
27
-
28
-
29
-
30
-
31
-
32
-
33
-
34
-
35
-
36
-
37
-
38
-
39
-
40
-
41
-
42
-
43
-
44
-
45
-
46
-
47
-
48
-
49
-
50
-
51
-
52
-
53
-
54
-
55
-
56
-
57
-
58
-
59
-
60
-
61
-
62
-
63
-
64
-
65
-
66
-
67
-
68
-
69
-
70
-
71
-
72
-
73
-
74
-
75
-
76
-
77
-
78
-
79
-
80
-
81
-
82
-
83
-
84
-
85
-
86
-
87
-
88
-
89
-
90
-
91
-
92
-
93
-
94
-
95
-
96
-
97
-
98
-
99
-
100
-
101
-
102
-
103
-
104
-
105
-
106
-
107
-
108
-
109
-
110
-
111
-
112
-
113
-
114
-
115
-
116
-
117
-
118
-
119
-
120
-
121
-
122
-
123
-
124
-
125
-
 126
126 -
 127
127 -
 128
128 -
 129
129 -
 130
130 -
 131
131 -
 132
132 -
 133
133 -
 134
134 -
 135
135 -
 136
136 -
 137
137 -
 138
138 -
 139
139 -
 140
140 -
 141
141 -
 142
142 -
 143
143 -
 144
144 -
 145
145 -
 146
146 -
147
-
148
-
149
-
150
-
151
-
152
-
153
-
154
-
155
-
156
-
157
-
158
-
159
-
160
-
161
-
162
-
163
-
164
-
165
-
166
-
167
-
168
-
169
-
170
-
171
-
172
-
173
-
174
-
175
-
176
-
177
-
178
-
179
-
180
-
181
-
182
-
183
-
184
-
185
-
186
-
187
-
188
-
189
-
190
-
191
-
192
-
193
-
194
-
195
-
196
 |
 |

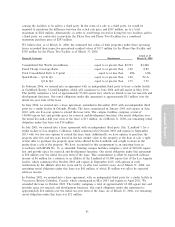
As of March 31, 2006 and 2005, our short-term investments were classiÑed as available-for-sale and,
consequently, recorded at fair market value with unrealized gains or losses resulting from changes in fair
value reported as a separate component of accumulated other comprehensive income, net of any tax
eÅects, in stockholders' equity. Our portfolio of short-term investments consisted of the following
investment categories, summarized by fair value as of March 31, 2006 and 2005 (in millions):
As of March 31,
2006 2005
U.S. agency securities ÏÏÏÏÏÏÏÏÏÏÏÏÏÏÏÏÏÏÏÏÏÏÏÏÏÏÏÏÏÏÏÏÏÏÏÏÏÏÏÏÏÏÏÏÏÏÏÏÏÏÏÏÏÏÏÏ $ 575 $1,168
U.S. Treasury securities ÏÏÏÏÏÏÏÏÏÏÏÏÏÏÏÏÏÏÏÏÏÏÏÏÏÏÏÏÏÏÏÏÏÏÏÏÏÏÏÏÏÏÏÏÏÏÏÏÏÏÏÏÏÏ 212 298
Corporate bonds ÏÏÏÏÏÏÏÏÏÏÏÏÏÏÏÏÏÏÏÏÏÏÏÏÏÏÏÏÏÏÏÏÏÏÏÏÏÏÏÏÏÏÏÏÏÏÏÏÏÏÏÏÏÏÏÏÏÏÏÏÏ 178 180
Asset-backed and other debt securities ÏÏÏÏÏÏÏÏÏÏÏÏÏÏÏÏÏÏÏÏÏÏÏÏÏÏÏÏÏÏÏÏÏÏÏÏÏÏÏÏÏÏ 65 42
Total short-term investments ÏÏÏÏÏÏÏÏÏÏÏÏÏÏÏÏÏÏÏÏÏÏÏÏÏÏÏÏÏÏÏÏÏÏÏÏÏÏÏÏÏÏÏÏÏÏÏÏ $1,030 $1,688
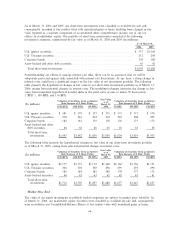
Notwithstanding our eÅorts to manage interest rate risks, there can be no assurance that we will be
adequately protected against risks associated with interest rate Öuctuations. At any time, a sharp change in
interest rates could have a signiÑcant impact on the fair value of our investment portfolio. The following
table presents the hypothetical changes in fair value in our short-term investment portfolio as of March 31,
2006, arising from potential changes in interest rates. The modeling technique estimates the change in fair
value from immediate hypothetical parallel shifts in the yield curve of plus or minus 50 basis points
(""BPS''), 100 BPS, and 150 BPS.
Fair Value
Valuation of Securities Given an Interest Valuation of Securities Given an Interest
as of
Rate Increase of X Basis Points Rate Increase of X Basis Points
March 31,(In millions) (150 BPS) (100 BPS) (50 BPS) 2006 50 BPS 100 BPS 150 BPS
U.S. agency securities ÏÏ $ 581 $ 579 $ 577 $ 575 $ 573 $ 571 $ 570
U.S. Treasury securities 218 216 214 212 210 208 205
Corporate bonds ÏÏÏÏÏÏ 182 181 179 178 176 175 173
Asset-backed and other
debt securities ÏÏÏÏÏÏ 66 66 66 65 65 65 65
Total short-term
investments ÏÏÏÏÏÏ $1,047 $1,042 $1,036 $1,030 $1,024 $1,019 $1,013
The following table presents the hypothetical changes in fair value in our short-term investment portfolio
as of March 31, 2005, arising from selected potential changes in interest rates.
Fair Value
Valuation of Securities Given an Interest Valuation of Securities Given an Interest
as of
Rate Decrease of X Basis Points Rate Increase of X Basis Points
March 31,(In millions) (150 BPS) (100 BPS) (50 BPS) 2005 50 BPS 100 BPS 150 BPS
U.S. agency securities ÏÏ $1,177 $1,175 $1,172 $1,168 $1,162 $1,156 $1,151
U.S. Treasury securities 306 303 300 298 295 293 290
Corporate bonds ÏÏÏÏÏÏ 185 184 182 180 178 177 175
Asset-backed securities 44 43 43 42 42 41 41
Total short-term
investments ÏÏÏÏÏÏ $1,712 $1,705 $1,697 $1,688 $1,677 $1,667 $1,657
Market Price Risk
The value of our equity investments in publicly traded companies are subject to market price volatility. As
of March 31, 2006, our marketable equity securities were classiÑed as available-for-sale and, consequently,
were recorded in our Consolidated Balance Sheets at fair market value with unrealized gains or losses
64