Electronic Arts 2006 Annual Report Download - page 122
Download and view the complete annual report
Please find page 122 of the 2006 Electronic Arts annual report below. You can navigate through the pages in the report by either clicking on the pages listed below, or by using the keyword search tool below to find specific information within the annual report.-
 1
1 -
2
-
3
-
4
-
5
-
6
-
7
-
8
-
9
-
10
-
11
-
12
-
13
-
14
-
15
-
16
-
17
-
18
-
19
-
20
-
21
-
22
-
23
-
24
-
25
-
26
-
27
-
28
-
29
-
30
-
31
-
32
-
33
-
34
-
35
-
36
-
37
-
38
-
39
-
40
-
41
-
42
-
43
-
44
-
45
-
46
-
47
-
48
-
49
-
50
-
51
-
52
-
53
-
54
-
55
-
56
-
57
-
58
-
59
-
60
-
61
-
62
-
63
-
64
-
65
-
66
-
67
-
68
-
69
-
70
-
71
-
72
-
73
-
74
-
75
-
76
-
77
-
78
-
79
-
80
-
81
-
82
-
83
-
84
-
85
-
86
-
87
-
88
-
89
-
90
-
91
-
92
-
93
-
94
-
95
-
96
-
97
-
98
-
99
-
100
-
101
-
102
-
103
-
104
-
105
-
106
-
107
-
108
-
109
-
110
-
111
-
 112
112 -
 113
113 -
 114
114 -
 115
115 -
 116
116 -
 117
117 -
 118
118 -
 119
119 -
 120
120 -
 121
121 -
 122
122 -
 123
123 -
 124
124 -
 125
125 -
 126
126 -
 127
127 -
 128
128 -
 129
129 -
 130
130 -
 131
131 -
 132
132 -
133
-
134
-
135
-
136
-
137
-
138
-
139
-
140
-
141
-
142
-
143
-
144
-
145
-
146
-
147
-
148
-
149
-
150
-
151
-
152
-
153
-
154
-
155
-
156
-
157
-
158
-
159
-
160
-
161
-
162
-
163
-
164
-
165
-
166
-
167
-
168
-
169
-
170
-
171
-
172
-
173
-
174
-
175
-
176
-
177
-
178
-
179
-
180
-
181
-
182
-
183
-
184
-
185
-
186
-
187
-
188
-
189
-
190
-
191
-
192
-
193
-
194
-
195
-
196
 |
 |

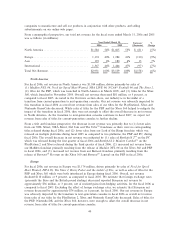
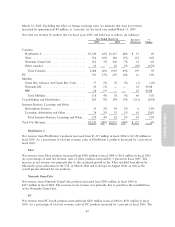
increase in PC net revenue was primarily due to higher sales of products in The Sims, Lord of the Rings
and Need for Speed franchises, partially oÅset by a decrease in sales of products in our Command and
Conquer
TM
and SimCity
TM
franchises.
Mobility
Net revenue from mobile products increased from $78 million in Ñscal 2004 to $118 million in Ñscal 2005.
Mobile products include all mobile devices such as handhelds and cellular handsets. The increase in
mobility net revenue was primarily due to the release of titles in conjunction with the launch of the
Nintendo DS and PSP platforms in North America and Japan.
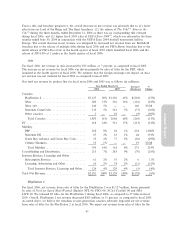
Co-Publishing and Distribution
In Ñscal 2005, net revenue from co-publishing and distribution products decreased by $115 million to
$283 million as compared to Ñscal 2004. The decrease was primarily due to a signiÑcant decrease in the
number of co-publishing and distribution titles we released in Ñscal 2005. We released six co-publishing
titles in Ñscal 2005 as compared to 11 titles in Ñscal 2004.
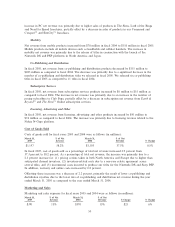
Subscription Services
In Ñscal 2005, net revenue from subscription services products increased by $6 million to $55 million as
compared to Ñscal 2004. The increase in net revenue was primarily due to an increase in the number of
paying subscribers to Club Pogo, partially oÅset by a decrease in subscription net revenue from Earth &
Beyond
TM
and The Sims
TM
Online subscription services.
Licensing, Advertising and Other
In Ñscal 2005, net revenue from licensing, advertising and other products increased by $41 million to
$74 million as compared to Ñscal 2004. The increase was primarily due to licensing revenue related to the
Nokia N-Gage platform.
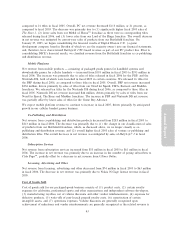
Cost of Goods Sold
Costs of goods sold for Ñscal years 2005 and 2004 were as follows (in millions):
March 31, % of Net March 31, % of Net
2005 Revenue 2004 Revenue % Change
$1,197 38.2% $1,103 37.3% 8.5%
In Ñscal 2005, cost of goods sold as a percentage of total net revenue increased 0.9 percent from
37.3 percent to 38.2 percent. As a percentage of total net revenue, the increase was primarily due to a
2.3 percent increase for: (1) pricing actions taken in both North America and Europe due to higher than
anticipated channel inventory, (2) inventory-related costs due to a one-year rebate agreement across
several titles, and (3) incremental costs incurred to produce our titles for the Nintendo DS and Sony PSP.
In addition, warranty and online costs increased by 0.8 percent.
OÅsetting these increases was a decrease of 2.2 percent, primarily the result of lower co-publishing and
distribution royalties due to the lower mix of co-publishing and distribution net revenue during the year
ended March 31, 2005 as compared to the year ended March 31, 2004.
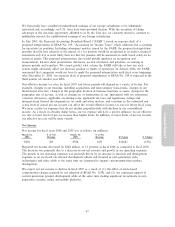
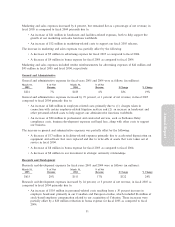
Marketing and Sales
Marketing and sales expenses for Ñscal years 2005 and 2004 were as follows (in millions):
March 31, % of Net March 31, % of Net
2005 Revenue 2004 Revenue $ Change % Change
$391 13% $370 13% $21 6%
50