Electronic Arts 2011 Annual Report Download - page 101
Download and view the complete annual report
Please find page 101 of the 2011 Electronic Arts annual report below. You can navigate through the pages in the report by either clicking on the pages listed below, or by using the keyword search tool below to find specific information within the annual report.-
 1
1 -
2
-
3
-
4
-
5
-
6
-
7
-
8
-
9
-
10
-
11
-
12
-
13
-
14
-
15
-
16
-
17
-
18
-
19
-
20
-
21
-
22
-
23
-
24
-
25
-
26
-
27
-
28
-
29
-
30
-
31
-
32
-
33
-
34
-
35
-
36
-
37
-
38
-
39
-
40
-
41
-
42
-
43
-
44
-
45
-
46
-
47
-
48
-
49
-
50
-
51
-
52
-
53
-
54
-
55
-
56
-
57
-
58
-
59
-
60
-
61
-
62
-
63
-
64
-
65
-
66
-
67
-
68
-
69
-
70
-
71
-
72
-
73
-
74
-
75
-
76
-
77
-
78
-
79
-
80
-
81
-
82
-
83
-
84
-
85
-
86
-
87
-
88
-
89
-
90
-
 91
91 -
 92
92 -
 93
93 -
 94
94 -
 95
95 -
 96
96 -
 97
97 -
 98
98 -
 99
99 -
 100
100 -
 101
101 -
 102
102 -
 103
103 -
 104
104 -
 105
105 -
 106
106 -
 107
107 -
 108
108 -
 109
109 -
 110
110 -
 111
111 -
112
-
113
-
114
-
115
-
116
-
117
-
118
-
119
-
120
-
121
-
122
-
123
-
124
-
125
-
126
-
127
-
128
-
129
-
130
-
131
-
132
-
133
-
134
-
135
-
136
-
137
-
138
-
139
-
140
-
141
-
142
-
143
-
144
-
145
-
146
-
147
-
148
-
149
-
150
-
151
-
152
-
153
-
154
-
155
-
156
-
157
-
158
-
159
-
160
-
161
-
162
-
163
-
164
-
165
-
166
-
167
-
168
-
169
-
170
-
171
-
172
-
173
-
174
-
175
-
176
-
177
-
178
-
179
-
180
-
181
-
182
-
183
-
184
-
185
-
186
-
187
-
188
-
189
-
190
-
191
-
192
 |
 |

Annual Report
PART II
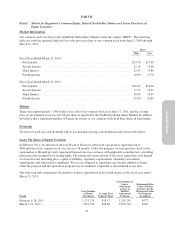
Item 5: Market for Registrant’s Common Equity, Related Stockholder Matters and Issuer Purchases of
Equity Securities
Market Information
Our common stock is traded on the NASDAQ Global Select Market under the symbol “ERTS.” The following
table sets forth the quarterly high and low sales price per share of our common stock from April 1, 2009 through
March 31, 2011.
Prices
High Low
Fiscal Year Ended March 31, 2010:
First Quarter .............................................................. $23.76 $17.48
Second Quarter ............................................................ 22.14 17.68
Third Quarter ............................................................. 21.05 15.86
Fourth Quarter ............................................................ 18.99 15.70
Fiscal Year Ended March 31, 2011:
First Quarter .............................................................. $20.24 $14.06
Second Quarter ............................................................ 17.53 14.32
Third Quarter ............................................................. 18.06 14.67
Fourth Quarter ............................................................ 20.20 14.80
Holders
There were approximately 1,580 holders of record of our common stock as of May 17, 2011, and the closing
price of our common stock was $23.38 per share as reported by the NASDAQ Global Select Market. In addition,
we believe that a significant number of beneficial owners of our common stock hold their shares in street name.
Dividends
We have not paid any cash dividends and do not anticipate paying cash dividends in the foreseeable future.
Issuer Purchases of Equity Securities
In February 2011, we announced that our Board of Directors authorized a program to repurchase up to
$600 million of our common stock over the next 18 months. Under the program, we may purchase stock in the
open market or through privately negotiated transactions in accordance with applicable securities laws, including
pursuant to pre-arranged stock trading plans. The timing and actual amount of the stock repurchases will depend
on several factors including price, capital availability, regulatory requirements, alternative investment
opportunities and other market conditions. We are not obligated to repurchase any specific number of shares
under the program and the repurchase program may be modified, suspended or discontinued at any time.
The following table summarizes the number of shares repurchased in the fourth quarter of the fiscal year ended
March 31, 2011:
Period
Total Number
of Shares
Purchased
Average Price
Paid per Share
Total Number of
Shares
Purchased
as Part of
Publicly
Announced
Program
Maximum Dollar
Value of Shares
that May Yet Be
Purchased Under
the Program
(in millions)
February 1-28, 2011 ....................... 1,231,239 $18.57 1,231,239 $577
March 1-31, 2011 ......................... 1,872,794 $18.86 1,872,794 $542
25