Electronic Arts 2011 Annual Report Download - page 149
Download and view the complete annual report
Please find page 149 of the 2011 Electronic Arts annual report below. You can navigate through the pages in the report by either clicking on the pages listed below, or by using the keyword search tool below to find specific information within the annual report.-
 1
1 -
2
-
3
-
4
-
5
-
6
-
7
-
8
-
9
-
10
-
11
-
12
-
13
-
14
-
15
-
16
-
17
-
18
-
19
-
20
-
21
-
22
-
23
-
24
-
25
-
26
-
27
-
28
-
29
-
30
-
31
-
32
-
33
-
34
-
35
-
36
-
37
-
38
-
39
-
40
-
41
-
42
-
43
-
44
-
45
-
46
-
47
-
48
-
49
-
50
-
51
-
52
-
53
-
54
-
55
-
56
-
57
-
58
-
59
-
60
-
61
-
62
-
63
-
64
-
65
-
66
-
67
-
68
-
69
-
70
-
71
-
72
-
73
-
74
-
75
-
76
-
77
-
78
-
79
-
80
-
81
-
82
-
83
-
84
-
85
-
86
-
87
-
88
-
89
-
90
-
91
-
92
-
93
-
94
-
95
-
96
-
97
-
98
-
99
-
100
-
101
-
102
-
103
-
104
-
105
-
106
-
107
-
108
-
109
-
110
-
111
-
112
-
113
-
114
-
115
-
116
-
117
-
118
-
119
-
120
-
121
-
122
-
123
-
124
-
125
-
126
-
127
-
128
-
129
-
130
-
131
-
132
-
133
-
134
-
135
-
136
-
137
-
138
-
 139
139 -
 140
140 -
 141
141 -
 142
142 -
 143
143 -
 144
144 -
 145
145 -
 146
146 -
 147
147 -
 148
148 -
 149
149 -
 150
150 -
 151
151 -
 152
152 -
 153
153 -
 154
154 -
 155
155 -
 156
156 -
 157
157 -
 158
158 -
 159
159 -
160
-
161
-
162
-
163
-
164
-
165
-
166
-
167
-
168
-
169
-
170
-
171
-
172
-
173
-
174
-
175
-
176
-
177
-
178
-
179
-
180
-
181
-
182
-
183
-
184
-
185
-
186
-
187
-
188
-
189
-
190
-
191
-
192
 |
 |

Annual Report
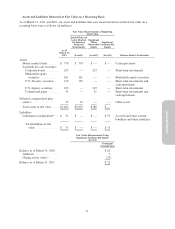
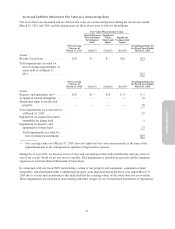
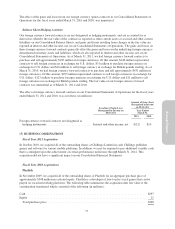
Assets and Liabilities Measured at Fair Value on a Nonrecurring Basis
Our assets that were measured and recorded at fair value on a nonrecurring basis during the fiscal years ended
March 31, 2011 and 2010, and the impairments on those assets were as follows (in millions):
Fair Value Measurements Using
Quoted Prices in
Active Markets
for Identical
Assets
Significant
Other
Observable
Inputs
Significant
Unobservable
Inputs
Net Carrying
Value as of
March 31, 2011 (Level 1) (Level 2) (Level 3)
Total Impairments for
the Fiscal Year Ended
March 31, 2011
Assets
Royalty-based asset .............. $10 $— $— $10 $13
Total impairments recorded for
non-recurring measurements on
assets held as of March 31,
2011 ........................ $13
Net Carrying
Value as of
March 31, 2010 (Level 1) (Level 2) (Level 3)
Total Impairments for
the Fiscal Year Ended
March 31, 2010
Assets
Property and equipment, net(a) ...... $20 $— $19 $ 4 $ 5
Acquisition-related intangibles ..... — — — — 10
Abandoned rights to intellectual
property ..................... — — — — 10
Total impairments for assets held as
of March 31, 2010 ............. 25
Impairment on acquisition-related
intangibles no longer held ....... 1
Impairment on property and
equipment no longer held ........ 13
Total impairments recorded for
non-recurring measurements . . . $39
(a) Our carrying value as of March 31, 2010, does not equal our fair value measurements at the time of the
impairments due to the subsequent recognition of depreciation expense.
During fiscal year 2011, we became aware of facts and circumstances that indicated that the carrying value of
one of our royalty-based assets was not recoverable. This impairment is included in research and development
expenses on our Consolidated Statement of Operations.
In connection with our fiscal 2010 restructuring, certain of our property and equipment, acquisition-related
intangibles, and abandoned rights to intellectual property were impaired during the fiscal year ended March 31,
2010 due to events and circumstances that indicated that the carrying values of the assets were not recoverable.
These impairments are included in restructuring and other charges on our Consolidated Statements of Operations.
73