Electronic Arts 2011 Annual Report Download - page 133
Download and view the complete annual report
Please find page 133 of the 2011 Electronic Arts annual report below. You can navigate through the pages in the report by either clicking on the pages listed below, or by using the keyword search tool below to find specific information within the annual report.-
 1
1 -
2
-
3
-
4
-
5
-
6
-
7
-
8
-
9
-
10
-
11
-
12
-
13
-
14
-
15
-
16
-
17
-
18
-
19
-
20
-
21
-
22
-
23
-
24
-
25
-
26
-
27
-
28
-
29
-
30
-
31
-
32
-
33
-
34
-
35
-
36
-
37
-
38
-
39
-
40
-
41
-
42
-
43
-
44
-
45
-
46
-
47
-
48
-
49
-
50
-
51
-
52
-
53
-
54
-
55
-
56
-
57
-
58
-
59
-
60
-
61
-
62
-
63
-
64
-
65
-
66
-
67
-
68
-
69
-
70
-
71
-
72
-
73
-
74
-
75
-
76
-
77
-
78
-
79
-
80
-
81
-
82
-
83
-
84
-
85
-
86
-
87
-
88
-
89
-
90
-
91
-
92
-
93
-
94
-
95
-
96
-
97
-
98
-
99
-
100
-
101
-
102
-
103
-
104
-
105
-
106
-
107
-
108
-
109
-
110
-
111
-
112
-
113
-
114
-
115
-
116
-
117
-
118
-
119
-
120
-
121
-
122
-
 123
123 -
 124
124 -
 125
125 -
 126
126 -
 127
127 -
 128
128 -
 129
129 -
 130
130 -
 131
131 -
 132
132 -
 133
133 -
 134
134 -
 135
135 -
 136
136 -
 137
137 -
 138
138 -
 139
139 -
 140
140 -
 141
141 -
 142
142 -
 143
143 -
144
-
145
-
146
-
147
-
148
-
149
-
150
-
151
-
152
-
153
-
154
-
155
-
156
-
157
-
158
-
159
-
160
-
161
-
162
-
163
-
164
-
165
-
166
-
167
-
168
-
169
-
170
-
171
-
172
-
173
-
174
-
175
-
176
-
177
-
178
-
179
-
180
-
181
-
182
-
183
-
184
-
185
-
186
-
187
-
188
-
189
-
190
-
191
-
192
 |
 |

Annual Report
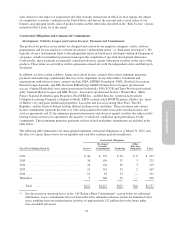
potential changes in interest rates. The modeling technique estimates the change in fair value from immediate
hypothetical parallel shifts in the yield curve of plus or minus 50 basis points (“BPS”), 100 BPS, and 150 BPS.
Valuation of Securities
Given an Interest Rate
Decrease of X Basis Points
Fair Value
as of
March 31,
2011
Valuation of Securities
Given an Interest Rate
Increase of X Basis Points
(In millions) (150 BPS) (100 BPS) (50 BPS) 50 BPS 100 BPS 150 BPS
Corporate bonds .................... $258 $257 $255 $253 $252 $250 $249
U.S. Treasury securities .............. 126 125 124 124 123 122 121
U.S. agency securities ................ 104 103 103 102 101 101 100
Commercial paper .................. 18 18 18 18 18 18 18
Total short-term investments ........ $506 $503 $500 $497 $494 $491 $488
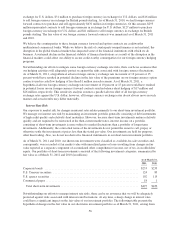
The following table presents the hypothetical changes in the fair value in our short-term investment portfolio as
of March 31, 2010, arising from selected potential changes in interest rates.
Valuation of Securities
Given an Interest Rate
Decrease of X Basis Points
Fair Value
as of
March 31,
2010
Valuation of Securities
Given an Interest Rate
Increase of X Basis Points
(In millions) (150 BPS) (100 BPS) (50 BPS) 50 BPS 100 BPS 150 BPS
Corporate bonds .................... $237 $236 $234 $233 $231 $229 $228
U.S. agency securities ............... 117 116 115 115 114 114 113
U.S. Treasury securities .............. 85 85 84 83 83 82 82
Commercial paper .................. 1 1 1 1 1 1 1
Total short-term investments ........ $440 $438 $434 $432 $429 $426 $424
Market Price Risk
The fair value of our marketable equity securities in publicly traded companies is subject to market price
volatility and foreign currency risk for investments denominated in foreign currencies. As of March 31, 2011 and
2010, our marketable equity securities were classified as available-for-sale securities and, consequently, were
recorded on our Consolidated Balance Sheets at fair market value with unrealized gains or losses resulting from
changes in fair value reported as a separate component of accumulated other comprehensive income, net of tax,
in stockholders’ equity. The fair value of our marketable equity securities as of March 31, 2011 and 2010 was
$161 million and $291 million, respectively.
Our marketable equity securities have been, and may continue to be, adversely impacted by volatility in the
public stock markets. At any time, a sharp change in market prices in our investments in marketable equity
securities could have a significant impact on the fair value of our investments. The following table presents
hypothetical changes in the fair value of our marketable equity securities as of March 31, 2011, arising from
changes in market prices of plus or minus 25 percent, 50 percent, and 75 percent.
Valuation of Securities
Given an X Percentage
Decrease in Each
Stock’s Market Price
Fair Value
as of
March 31,
2011
Valuation of Securities
Given an X Percentage
Increase in Each
Stock’s Market Price
(In millions) (75%) (50%) (25%) 25% 50% 75%
Marketable equity securities ...................... $40 $81 $121 $161 $201 $242 $282
The following table presents hypothetical changes in the fair value of our marketable equity securities as of
March 31, 2010, arising from changes in market prices of plus or minus 25 percent, 50 percent, and 75 percent.
Valuation of Securities
Given an X Percentage
Decrease in Each
Stock’s Market Price
Fair Value
as of
March 31,
2010
Valuation of Securities
Given an X Percentage
Increase in Each
Stock’s Market Price
(In millions) (75%) (50%) (25%) 25% 50% 75%
Marketable equity securities ...................... $73 $146 $218 $291 $364 $437 $509
57