Electronic Arts 2011 Annual Report Download - page 38
Download and view the complete annual report
Please find page 38 of the 2011 Electronic Arts annual report below. You can navigate through the pages in the report by either clicking on the pages listed below, or by using the keyword search tool below to find specific information within the annual report.-
 1
1 -
2
-
3
-
4
-
5
-
6
-
7
-
8
-
9
-
10
-
11
-
12
-
13
-
14
-
15
-
16
-
17
-
18
-
19
-
20
-
21
-
22
-
23
-
24
-
25
-
26
-
27
-
 28
28 -
 29
29 -
 30
30 -
 31
31 -
 32
32 -
 33
33 -
 34
34 -
 35
35 -
 36
36 -
 37
37 -
 38
38 -
 39
39 -
 40
40 -
 41
41 -
 42
42 -
 43
43 -
 44
44 -
 45
45 -
 46
46 -
 47
47 -
 48
48 -
49
-
50
-
51
-
52
-
53
-
54
-
55
-
56
-
57
-
58
-
59
-
60
-
61
-
62
-
63
-
64
-
65
-
66
-
67
-
68
-
69
-
70
-
71
-
72
-
73
-
74
-
75
-
76
-
77
-
78
-
79
-
80
-
81
-
82
-
83
-
84
-
85
-
86
-
87
-
88
-
89
-
90
-
91
-
92
-
93
-
94
-
95
-
96
-
97
-
98
-
99
-
100
-
101
-
102
-
103
-
104
-
105
-
106
-
107
-
108
-
109
-
110
-
111
-
112
-
113
-
114
-
115
-
116
-
117
-
118
-
119
-
120
-
121
-
122
-
123
-
124
-
125
-
126
-
127
-
128
-
129
-
130
-
131
-
132
-
133
-
134
-
135
-
136
-
137
-
138
-
139
-
140
-
141
-
142
-
143
-
144
-
145
-
146
-
147
-
148
-
149
-
150
-
151
-
152
-
153
-
154
-
155
-
156
-
157
-
158
-
159
-
160
-
161
-
162
-
163
-
164
-
165
-
166
-
167
-
168
-
169
-
170
-
171
-
172
-
173
-
174
-
175
-
176
-
177
-
178
-
179
-
180
-
181
-
182
-
183
-
184
-
185
-
186
-
187
-
188
-
189
-
190
-
191
-
192
 |
 |
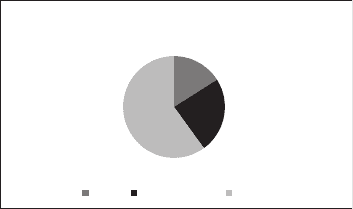
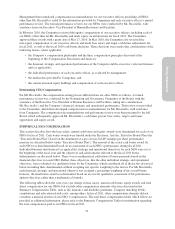
Consistent with our philosophy and the objectives of our executive compensation program, the mix of total direct
compensation collectively for our NEOs for fiscal 2011, excluding Mr. Schappert who did not receive a bonus
for fiscal 2011, was as follows:
NEO Compensation Mix
Base Annual Bonus Equity
16%
24%
60%
The Committee believes that this mix reflects the Company’s compensation philosophy and the core principles
discussed above.
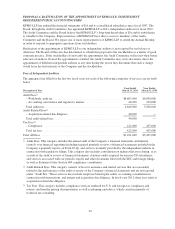
The amount of total direct compensation that each of our NEOs actually received, in the form of base salary paid,
bonus awarded, and the value of equity that vested or was exercised during fiscal 2011 was below the low end of
the market range, based on market data for the fourth quarter of fiscal 2011, with the exception of Mr. Gibeau
whose total direct compensation was within the market range. In fiscal years when stock performance is below
expectations, our NEOs will generally realize total direct compensation below our targeted range. Specifically, in
fiscal 2011, our NEOs realized total direct compensation below our targeted range primarily due to the fact that
no compensation was realized from the fiscal 2009 performance RSUs and no NEOs exercised stock options.
Equity compensation accounts for a significant portion of our NEOs’ compensation, and the lack of realized
compensation from these prior equity awards demonstrates how our NEOs’ actual compensation aligns with our
compensation principles and stockholder interests. The amounts actually received by each NEO can be found in
the compensation tables that follow this discussion.
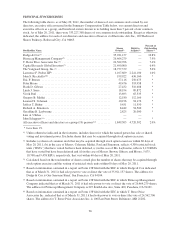
THE COMMITTEE’S PROCESS FOR DETERMINING AND REVIEWING NEO COMPENSATION
For fiscal 2011, the Committee reviewed and approved the total direct compensation of each of our NEOs (other
than for Mr. Riccitiello) in consultation with Compensia (an independent compensation consulting firm retained
by the Committee) and members of Company management, pursuant to the process described below. The
compensation setting process for Mr. Riccitiello is discussed below.
The first step in this process occurred in the third quarter of fiscal 2010 when the Committee examined market
compensation practices and general trends for executive compensation.
To assess market compensation practices, the Committee first determined an appropriate group of comparable
companies (our “peer group”). For fiscal 2011, the Committee elected to maintain the same peer group of
companies that were used for comparison purposes in fiscal 2010. These are companies with comparable
revenue, geographic markets, financial performance and expected growth rates in the following sectors:
• videogame companies (Activision Blizzard, Take-Two Interactive and THQ);
• technology/Internet companies (Adobe Systems, eBay, Expedia, IAC/Interactive Corp., Intuit, Symantec
and Yahoo!);
• entertainment companies (Discovery Communications, Lions Gate Entertainment and Warner Music
Group); and
• toy/game companies (Hasbro and Mattel).
Compensia then conducted a comprehensive analysis of our executive compensation programs using data from
the Radford High Technology Executive Compensation Surveys, the Croner Software Games Survey, and
publicly available information on our peer group. This analysis included a comparison of the compensation of
each of our executive-level positions to similar positions in the market. Compensia’s findings were provided to
the Committee in February 2010.
30