Electronic Arts 2011 Annual Report Download - page 119
Download and view the complete annual report
Please find page 119 of the 2011 Electronic Arts annual report below. You can navigate through the pages in the report by either clicking on the pages listed below, or by using the keyword search tool below to find specific information within the annual report.-
 1
1 -
2
-
3
-
4
-
5
-
6
-
7
-
8
-
9
-
10
-
11
-
12
-
13
-
14
-
15
-
16
-
17
-
18
-
19
-
20
-
21
-
22
-
23
-
24
-
25
-
26
-
27
-
28
-
29
-
30
-
31
-
32
-
33
-
34
-
35
-
36
-
37
-
38
-
39
-
40
-
41
-
42
-
43
-
44
-
45
-
46
-
47
-
48
-
49
-
50
-
51
-
52
-
53
-
54
-
55
-
56
-
57
-
58
-
59
-
60
-
61
-
62
-
63
-
64
-
65
-
66
-
67
-
68
-
69
-
70
-
71
-
72
-
73
-
74
-
75
-
76
-
77
-
78
-
79
-
80
-
81
-
82
-
83
-
84
-
85
-
86
-
87
-
88
-
89
-
90
-
91
-
92
-
93
-
94
-
95
-
96
-
97
-
98
-
99
-
100
-
101
-
102
-
103
-
104
-
105
-
106
-
107
-
108
-
 109
109 -
 110
110 -
 111
111 -
 112
112 -
 113
113 -
 114
114 -
 115
115 -
 116
116 -
 117
117 -
 118
118 -
 119
119 -
 120
120 -
 121
121 -
 122
122 -
 123
123 -
 124
124 -
 125
125 -
 126
126 -
 127
127 -
 128
128 -
 129
129 -
130
-
131
-
132
-
133
-
134
-
135
-
136
-
137
-
138
-
139
-
140
-
141
-
142
-
143
-
144
-
145
-
146
-
147
-
148
-
149
-
150
-
151
-
152
-
153
-
154
-
155
-
156
-
157
-
158
-
159
-
160
-
161
-
162
-
163
-
164
-
165
-
166
-
167
-
168
-
169
-
170
-
171
-
172
-
173
-
174
-
175
-
176
-
177
-
178
-
179
-
180
-
181
-
182
-
183
-
184
-
185
-
186
-
187
-
188
-
189
-
190
-
191
-
192
 |
 |

Annual Report
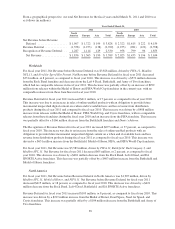
During fiscal year 2010, we incurred $116 million of restructuring charges of which (1) $62 million were for
employee-related expenses, (2) $32 million related to intangible asset impairment costs, abandoned rights to
intellectual property, and costs to assist in the reorganization of our business support functions, and (3) $22
million related to the closure of certain of our facilities. In fiscal year 2012, we anticipate incurring less than $10
million of restructuring charges related to the fiscal 2010 restructuring.
Overall, including charges incurred through March 31, 2011, we expect to incur total cash and non-cash charges
of approximately $135 million by March 31, 2012. These charges consist primarily of (1) employee-related costs
(approximately $62 million), (2) intangible asset impairment costs, abandoned rights to intellectual property
costs, and other costs to assist in the reorganization of our business support functions (approximately $50
million), and (3) facilities exit costs (approximately $22 million).
Other Restructuring and Reorganization
In connection with our fiscal 2009 restructuring plan and fiscal 2008 reorganization plan, during fiscal year 2010,
we incurred $14 million and $10 million of charges, respectively, primarily for facilities-related expenses under
the fiscal 2009 plan and contracted services costs to assist in the reorganization of our business support functions
under the fiscal 2008 plan. We do not expect to incur any additional charges under these plans.
Acquisition-Related Contingent Consideration
Acquisition-related contingent consideration related to Playfish decreased $19 million for the fiscal year 2011 as
compared to the fiscal year 2010, resulting from a revision in our estimate of the expected future cash flows over
the period in which the contingent obligation is expected to be settled. See Note 2 and Note 5 of the Notes to
Consolidated Financial Statements included in Item 8 of this report.
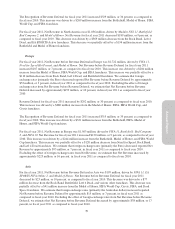
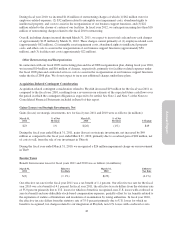
Gains (Losses) on Strategic Investments, Net
Gains (losses) on strategic investments, net, for fiscal years 2011 and 2010 were as follows (in millions):
March 31,
2011
% of Net
Revenue
March 31,
2010
% of Net
Revenue $ Change
$23 1% $(26) (1%) $49
During the fiscal year ended March 31, 2011, gains (losses) on strategic investments, net increased by $49
million as compared to the fiscal year ended March 31, 2010, primarily due to a realized gain of $28 million, net
of costs to sell, from the sale of our investment in Ubisoft.
During the fiscal year ended March 31, 2010, we recognized a $26 million impairment charge on our investment
in The9.
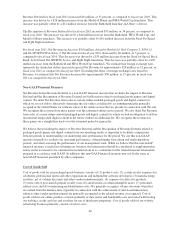
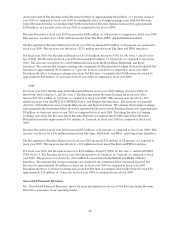
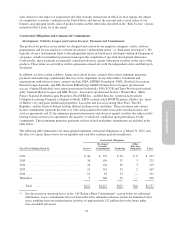
Income Taxes
Benefit from income taxes for fiscal years 2011 and 2010 was as follows (in millions):
March 31,
2011
Effective
Tax Rate
March 31,
2010
Effective
Tax Rate
$(3) (1.1%) $(29) (4.1%)
Our effective tax rate for the fiscal year 2011 was a tax benefit of 1.1 percent. Our effective tax rate for the fiscal
year 2010 was a tax benefit of 4.1 percent. In fiscal year 2011, the effective tax rate differs from the statutory rate
of 35.0 percent primarily due to U.S. losses for which no benefit is recognized, non-U.S. losses with a reduced or
zero tax benefit and non-deductible stock-based compensation expenses, partially offset by tax benefits related to
the expiration of statutes of limitations and resolution of examination by taxing authorities. In fiscal year 2010,
the effective tax rate differs from the statutory rate of 35.0 percent primarily due to U.S. losses for which no
benefit is recognized, tax charges related to our integration of Playfish, non-U.S. losses with a reduced or zero
43