Electronic Arts 2011 Annual Report Download - page 125
Download and view the complete annual report
Please find page 125 of the 2011 Electronic Arts annual report below. You can navigate through the pages in the report by either clicking on the pages listed below, or by using the keyword search tool below to find specific information within the annual report.-
 1
1 -
2
-
3
-
4
-
5
-
6
-
7
-
8
-
9
-
10
-
11
-
12
-
13
-
14
-
15
-
16
-
17
-
18
-
19
-
20
-
21
-
22
-
23
-
24
-
25
-
26
-
27
-
28
-
29
-
30
-
31
-
32
-
33
-
34
-
35
-
36
-
37
-
38
-
39
-
40
-
41
-
42
-
43
-
44
-
45
-
46
-
47
-
48
-
49
-
50
-
51
-
52
-
53
-
54
-
55
-
56
-
57
-
58
-
59
-
60
-
61
-
62
-
63
-
64
-
65
-
66
-
67
-
68
-
69
-
70
-
71
-
72
-
73
-
74
-
75
-
76
-
77
-
78
-
79
-
80
-
81
-
82
-
83
-
84
-
85
-
86
-
87
-
88
-
89
-
90
-
91
-
92
-
93
-
94
-
95
-
96
-
97
-
98
-
99
-
100
-
101
-
102
-
103
-
104
-
105
-
106
-
107
-
108
-
109
-
110
-
111
-
112
-
113
-
114
-
 115
115 -
 116
116 -
 117
117 -
 118
118 -
 119
119 -
 120
120 -
 121
121 -
 122
122 -
 123
123 -
 124
124 -
 125
125 -
 126
126 -
 127
127 -
 128
128 -
 129
129 -
 130
130 -
 131
131 -
 132
132 -
 133
133 -
 134
134 -
 135
135 -
136
-
137
-
138
-
139
-
140
-
141
-
142
-
143
-
144
-
145
-
146
-
147
-
148
-
149
-
150
-
151
-
152
-
153
-
154
-
155
-
156
-
157
-
158
-
159
-
160
-
161
-
162
-
163
-
164
-
165
-
166
-
167
-
168
-
169
-
170
-
171
-
172
-
173
-
174
-
175
-
176
-
177
-
178
-
179
-
180
-
181
-
182
-
183
-
184
-
185
-
186
-
187
-
188
-
189
-
190
-
191
-
192
 |
 |

Annual Report
Certain Abandoned Acquisition-Related Costs
Certain abandoned acquisition-related costs consist of costs we incurred in connection with the abandoned
acquisition of Take-Two. On August 18, 2008, we allowed our tender offer for Take-Two shares to expire and on
September 14, 2008, we announced that we had terminated discussions with Take-Two. As a result, during the
fiscal year ended March 31, 2009, we recognized $21 million in related costs consisting of legal, banking and
other consulting fees.
Goodwill Impairment
Adverse economic conditions, including the decline in our market capitalization and our expected financial
performance at the time, indicated that a potential impairment of goodwill existed during the fiscal year ended
March 31, 2009. As a result, we performed goodwill impairment tests for our reporting units. As a result of the
goodwill impairment analysis, we determined that our EA Mobile reporting unit’s goodwill was impaired.
Substantially all of our goodwill associated with our EA Mobile reporting unit was derived from our fiscal 2006
acquisition of JAMDAT Mobile Inc. During the fiscal year ended March 31, 2009, we recognized a goodwill
impairment charge of $368 million related to our EA Mobile reporting unit. During the fiscal year ended
March 31, 2010, we performed our annual goodwill impairment test for our reporting units, and we determined
that there were no indicators of impairment to our goodwill.
Gains (Losses) on Strategic Investments, Net
Gains (losses) on strategic investments, net for fiscal years 2010 and 2009 were as follows (in millions):
March 31,
2010
% of Net
Revenue
March 31,
2009
% of Net
Revenue $ Change % Change
$(26) (1%) $(62) (1%) $36 58%
During the fiscal year ended March 31, 2010, gains (losses) on strategic investments, net decreased by $36
million, or 58 percent, as compared to the fiscal year ended March 31, 2009. We recognized a $26 million
impairment charge on our investment in The9 during the fiscal year ended March 31, 2010.
During the fiscal year ended March 31, 2009, we recognized (1) $40 million of impairment charges on our
investments in Neowiz’s common and preferred shares and (2) a $27 million impairment charge on our
investment in The9. These charges were offset by a $5 million dividend received from our investment in The9.
Interest and Other Income, Net
Interest and other income, net, for fiscal years 2010 and 2009 were as follows (in millions):
March 31,
2010
% of Net
Revenue
March 31,
2009
% of Net
Revenue $ Change % Change
$6 — $34 1% $(28) (82%)
For fiscal year 2010, interest and other income, net, decreased by $28 million, or 82 percent, as compared to
fiscal year 2009, primarily due to a decrease in interest income resulting from lower yields and balances on our
cash and cash equivalents and short-term investments.
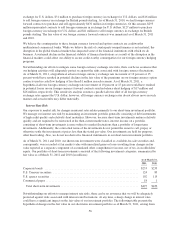
Income Taxes
Provision for (benefit from) income taxes for fiscal years 2010 and 2009 were as follows (in millions):
March 31,
2010
Effective
Tax Rate
March 31,
2009
Effective
Tax Rate % Change
$(29) (4.1%) $233 27.2% (112%)
Our effective income tax rate was a tax benefit of 4.1 percent for fiscal year 2010. Our effective income tax rate
was 27.2 percent for fiscal year 2009. In fiscal year 2010, our effective tax rate differed from the U.S. statutory
49