Electronic Arts 2011 Annual Report Download - page 117
Download and view the complete annual report
Please find page 117 of the 2011 Electronic Arts annual report below. You can navigate through the pages in the report by either clicking on the pages listed below, or by using the keyword search tool below to find specific information within the annual report.-
 1
1 -
2
-
3
-
4
-
5
-
6
-
7
-
8
-
9
-
10
-
11
-
12
-
13
-
14
-
15
-
16
-
17
-
18
-
19
-
20
-
21
-
22
-
23
-
24
-
25
-
26
-
27
-
28
-
29
-
30
-
31
-
32
-
33
-
34
-
35
-
36
-
37
-
38
-
39
-
40
-
41
-
42
-
43
-
44
-
45
-
46
-
47
-
48
-
49
-
50
-
51
-
52
-
53
-
54
-
55
-
56
-
57
-
58
-
59
-
60
-
61
-
62
-
63
-
64
-
65
-
66
-
67
-
68
-
69
-
70
-
71
-
72
-
73
-
74
-
75
-
76
-
77
-
78
-
79
-
80
-
81
-
82
-
83
-
84
-
85
-
86
-
87
-
88
-
89
-
90
-
91
-
92
-
93
-
94
-
95
-
96
-
97
-
98
-
99
-
100
-
101
-
102
-
103
-
104
-
105
-
106
-
 107
107 -
 108
108 -
 109
109 -
 110
110 -
 111
111 -
 112
112 -
 113
113 -
 114
114 -
 115
115 -
 116
116 -
 117
117 -
 118
118 -
 119
119 -
 120
120 -
 121
121 -
 122
122 -
 123
123 -
 124
124 -
 125
125 -
 126
126 -
 127
127 -
128
-
129
-
130
-
131
-
132
-
133
-
134
-
135
-
136
-
137
-
138
-
139
-
140
-
141
-
142
-
143
-
144
-
145
-
146
-
147
-
148
-
149
-
150
-
151
-
152
-
153
-
154
-
155
-
156
-
157
-
158
-
159
-
160
-
161
-
162
-
163
-
164
-
165
-
166
-
167
-
168
-
169
-
170
-
171
-
172
-
173
-
174
-
175
-
176
-
177
-
178
-
179
-
180
-
181
-
182
-
183
-
184
-
185
-
186
-
187
-
188
-
189
-
190
-
191
-
192
 |
 |

Annual Report
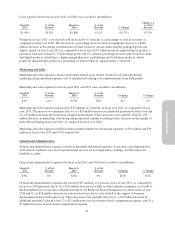
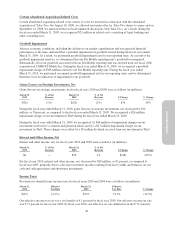
Cost of goods sold for fiscal years 2011 and 2010 was as follows (in millions):
March 31,
2011
% of Net
Revenue
March 31,
2010
% of Net
Revenue % Change
Change as a
% of Net
Revenue
$1,499 41.8% $1,866 51.1% (19.7%) (9.3%)
During fiscal year 2011, cost of goods sold decreased by 9.3 percent as a percentage of total net revenue as
compared to fiscal year 2010. This decrease as a percentage of net revenue was primarily due to (1) a $266
million decrease in the change in deferred net revenue related to certain online-enabled packaged goods and
digital content for fiscal year 2011 as compared to fiscal year 2010, which positively impacted gross profit as a
percent of total net revenue by 3.7 percentage points and (2) a greater percentage of net revenue from EA studio
and digital products, which have a higher margin than our co-publishing and distribution products, which
positively impacted gross profit as a percentage of total revenue by approximately 3.3 percent.
Marketing and Sales
Marketing and sales expenses consist of personnel-related costs, related overhead costs and advertising,
marketing and promotional expenses, net of qualified advertising cost reimbursements from third parties.
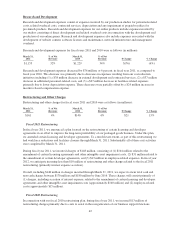
Marketing and sales expenses for fiscal years 2011 and 2010 were as follows (in millions):
March 31,
2011
% of Net
Revenue
March 31,
2010
% of Net
Revenue $ Change % Change
$747 21% $730 20% $17 2%
Marketing and sales expenses increased by $17 million, or 2 percent, in fiscal year 2011, as compared to fiscal
year 2010. The increase was primarily due to (1) a $13 million increase in additional personnel-related costs and
(2) a $5 million increase in stock-based compensation expense. These increases were partially offset by a $5
million decrease in marketing, advertising and promotional expenses resulting from a decrease in the number of
titles released during fiscal year 2011 as compared to fiscal year 2010.
Marketing and sales expenses included vendor reimbursements for advertising expenses of $31 million and $39
million in fiscal years 2011 and 2010, respectively.
General and Administrative
General and administrative expenses consist of personnel and related expenses of executive and administrative
staff, related overhead costs, fees for professional services such as legal and accounting, and allowances for
doubtful accounts.
General and administrative expenses for fiscal years 2011 and 2010 were as follows (in millions):
March 31,
2011
% of Net
Revenue
March 31,
2010
% of Net
Revenue $ Change % Change
$301 8% $320 9% $(19) (6%)
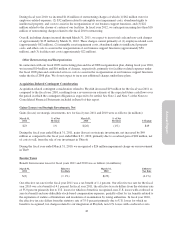
General and administrative expenses decreased by $19 million, or 6 percent, in fiscal year 2011, as compared to
fiscal year 2010 primarily due to (1) a $25 million decrease in facilities-related expenses, primarily as a result of
the $14 million loss on our lease obligation related to our Redwood Shores headquarters facilities in fiscal year
2010 and (2) an $18 million decrease in contracted services due to costs related to the support of business
development projects in the prior year. These decreases were partially offset by (1) a $13 million increase in
additional personnel- related costs, (2) a $12 million increase in incentive-based compensation expense, and (3) a
$7 million increase in stock-based compensation expense.
41