Electronic Arts 2011 Annual Report Download - page 168
Download and view the complete annual report
Please find page 168 of the 2011 Electronic Arts annual report below. You can navigate through the pages in the report by either clicking on the pages listed below, or by using the keyword search tool below to find specific information within the annual report.-
 1
1 -
2
-
3
-
4
-
5
-
6
-
7
-
8
-
9
-
10
-
11
-
12
-
13
-
14
-
15
-
16
-
17
-
18
-
19
-
20
-
21
-
22
-
23
-
24
-
25
-
26
-
27
-
28
-
29
-
30
-
31
-
32
-
33
-
34
-
35
-
36
-
37
-
38
-
39
-
40
-
41
-
42
-
43
-
44
-
45
-
46
-
47
-
48
-
49
-
50
-
51
-
52
-
53
-
54
-
55
-
56
-
57
-
58
-
59
-
60
-
61
-
62
-
63
-
64
-
65
-
66
-
67
-
68
-
69
-
70
-
71
-
72
-
73
-
74
-
75
-
76
-
77
-
78
-
79
-
80
-
81
-
82
-
83
-
84
-
85
-
86
-
87
-
88
-
89
-
90
-
91
-
92
-
93
-
94
-
95
-
96
-
97
-
98
-
99
-
100
-
101
-
102
-
103
-
104
-
105
-
106
-
107
-
108
-
109
-
110
-
111
-
112
-
113
-
114
-
115
-
116
-
117
-
118
-
119
-
120
-
121
-
122
-
123
-
124
-
125
-
126
-
127
-
128
-
129
-
130
-
131
-
132
-
133
-
134
-
135
-
136
-
137
-
138
-
139
-
140
-
141
-
142
-
143
-
144
-
145
-
146
-
147
-
148
-
149
-
150
-
151
-
152
-
153
-
154
-
155
-
156
-
157
-
 158
158 -
 159
159 -
 160
160 -
 161
161 -
 162
162 -
 163
163 -
 164
164 -
 165
165 -
 166
166 -
 167
167 -
 168
168 -
 169
169 -
 170
170 -
 171
171 -
 172
172 -
 173
173 -
 174
174 -
 175
175 -
 176
176 -
 177
177 -
 178
178 -
179
-
180
-
181
-
182
-
183
-
184
-
185
-
186
-
187
-
188
-
189
-
190
-
191
-
192
 |
 |

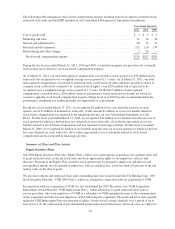
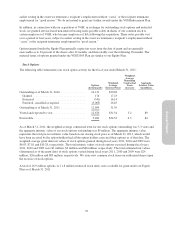
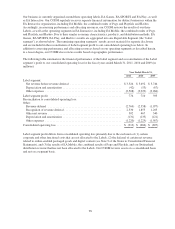
The following table summarizes stock-based compensation expense resulting from stock options, restricted stock,
restricted stock units and the ESPP included in our Consolidated Statements of Operations (in millions):
Year Ended March 31,
2011 2010 2009
Cost of goods sold ..........................................................$2$2$2
Marketing and sales ......................................................... 21 16 20
General and administrative ................................................... 40 33 47
Research and development ................................................... 111 110 134
Restructuring and other charges ............................................... 2 26 —
Stock-based compensation expense .......................................... $176 $187 $203
During the fiscal years ended March 31, 2011, 2010 and 2009, we did not recognize any provision for or benefit
from income taxes related to our stock-based compensation expense.
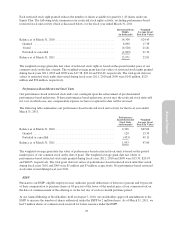
As of March 31, 2011, our total unrecognized compensation cost related to stock options was $36 million and is
expected to be recognized over a weighted-average service period of 1.5 years. As of March 31, 2011, our total
unrecognized compensation cost related to restricted stock, restricted stock units and notes payable in shares of
common stock (collectively referred to as “restricted stock rights”) was $255 million and is expected to be
recognized over a weighted-average service period of 1.9 years. Of the $255 million of unrecognized
compensation cost noted above, $24 million relates to performance-based restricted stock units for which we
ceased recognizing stock-based compensation expense during fiscal year 2010 because we determined that the
performance attainment was neither probable nor improbable of achievement.
For the fiscal year ended March 31, 2011, we recognized $2 million of tax costs from the exercise of stock
options, net of $3 million of deferred tax write-offs; of this amount $1 million of excess tax benefit related to
stock-based compensation was reported in the financing activities on our Consolidated Statements of Cash
Flows. For the fiscal year ended March 31, 2010, we recognized $14 million of tax benefits from the exercise of
stock options for which we did not have any deferred tax asset write-offs; all of which represented excess tax
benefits related to stock-based compensation and was reported in financing activities. For the fiscal year ended
March 31, 2009, we recognized $2 million of tax benefits from the exercise of stock options for which we did not
have any deferred tax asset write-offs; all of which represented excess tax benefits related to stock-based
compensation and was reported in financing activities.
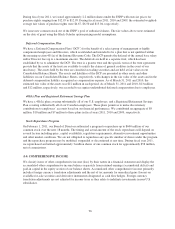
Summary of Plans and Plan Activity
Equity Incentive Plans
Our 2000 Equity Incentive Plan (the “Equity Plan”) allows us to grant options to purchase our common stock and
to grant restricted stock, restricted stock units and stock appreciation rights to our employees, officers and
directors. Pursuant to the Equity Plan, incentive stock options may be granted to employees and officers and
non-qualified options may be granted to employees, officers and directors, at not less than 100 percent of the fair
market value on the date of grant.
We also have options and restricted stock units outstanding that were granted under the VG Holding Corp. 2005
Stock Incentive Plan (the “VGH 2005 Plan”), which we assumed in connection with our acquisition of VGH.
In connection with our acquisition of VGH, we also established the 2007 Electronic Arts VGH Acquisition
Inducement Award Plan (the “VGH Inducement Plan”), which allowed us to grant restricted stock units to
service providers, who were employees of VGH or a subsidiary of VGH immediately prior to the consummation
of the acquisition and who became employees of EA following the acquisition. The restricted stock units granted
under the VGH Inducement Plan vest pursuant to either (1) time-based vesting schedules over a period of up to
four years or (2) the achievement of pre-determined performance-based milestones, and in all cases are subject to
92