Electronic Arts 2011 Annual Report Download - page 124
Download and view the complete annual report
Please find page 124 of the 2011 Electronic Arts annual report below. You can navigate through the pages in the report by either clicking on the pages listed below, or by using the keyword search tool below to find specific information within the annual report.-
 1
1 -
2
-
3
-
4
-
5
-
6
-
7
-
8
-
9
-
10
-
11
-
12
-
13
-
14
-
15
-
16
-
17
-
18
-
19
-
20
-
21
-
22
-
23
-
24
-
25
-
26
-
27
-
28
-
29
-
30
-
31
-
32
-
33
-
34
-
35
-
36
-
37
-
38
-
39
-
40
-
41
-
42
-
43
-
44
-
45
-
46
-
47
-
48
-
49
-
50
-
51
-
52
-
53
-
54
-
55
-
56
-
57
-
58
-
59
-
60
-
61
-
62
-
63
-
64
-
65
-
66
-
67
-
68
-
69
-
70
-
71
-
72
-
73
-
74
-
75
-
76
-
77
-
78
-
79
-
80
-
81
-
82
-
83
-
84
-
85
-
86
-
87
-
88
-
89
-
90
-
91
-
92
-
93
-
94
-
95
-
96
-
97
-
98
-
99
-
100
-
101
-
102
-
103
-
104
-
105
-
106
-
107
-
108
-
109
-
110
-
111
-
112
-
113
-
 114
114 -
 115
115 -
 116
116 -
 117
117 -
 118
118 -
 119
119 -
 120
120 -
 121
121 -
 122
122 -
 123
123 -
 124
124 -
 125
125 -
 126
126 -
 127
127 -
 128
128 -
 129
129 -
 130
130 -
 131
131 -
 132
132 -
 133
133 -
 134
134 -
135
-
136
-
137
-
138
-
139
-
140
-
141
-
142
-
143
-
144
-
145
-
146
-
147
-
148
-
149
-
150
-
151
-
152
-
153
-
154
-
155
-
156
-
157
-
158
-
159
-
160
-
161
-
162
-
163
-
164
-
165
-
166
-
167
-
168
-
169
-
170
-
171
-
172
-
173
-
174
-
175
-
176
-
177
-
178
-
179
-
180
-
181
-
182
-
183
-
184
-
185
-
186
-
187
-
188
-
189
-
190
-
191
-
192
 |
 |

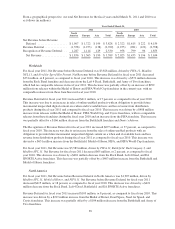
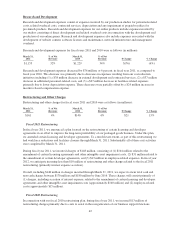
Research and development expenses decreased by $130 million, or 10 percent, in fiscal year 2010, as compared
to fiscal year 2009. The decrease was primarily due to (1) a decrease of $82 million in additional personnel-
related costs primarily resulting from our cost reduction initiatives, (2) a decrease of $46 million in external
development and contracted services, and (3) a decrease of $24 million in stock-based compensation expense.
These decreases were partially offset by a $23 million increase in incentive-based compensation expense.
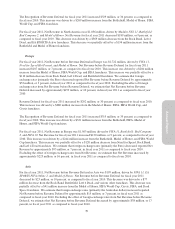
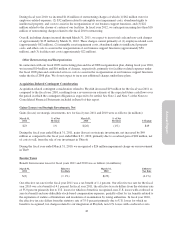
Restructuring Charges
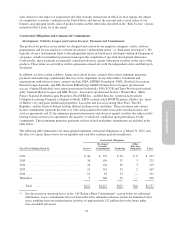
Restructuring charges for fiscal years 2010 and 2009 were as follows (in millions):
March 31,
2010
% of Net
Revenue
March 31,
2009
% of Net
Revenue $ Change % Change
$140 4% $80 2% $60 75%
Fiscal 2010 Restructuring
In fiscal year 2010, we announced a restructuring plan to narrow our product portfolio to provide greater focus on
titles with higher margin opportunities. Under this plan, we reduced our workforce by approximately 1,100
employees and have (1) consolidated or closed various facilities, (2) eliminated certain titles, and (3) incurred IT
and other costs to assist in reorganizing certain activities. Substantially all of these exit activities were completed
by March 31, 2010.
During fiscal year 2010, we incurred $116 million of restructuring charges, of which (1) $62 million were for
employee-related expenses, (2) $32 million related to intangible asset impairment costs, abandoned rights to
intellectual property, and other costs to assist in the reorganization of our business support functions, and (3) $22
million related to the closure of certain of our facilities.
Other Restructuring and Reorganization
In connection with our fiscal 2009 restructuring plan and fiscal 2008 reorganization plan, during fiscal year 2010,
we incurred $14 million and $10 million of charges, respectively, primarily for facilities-related expenses under
the fiscal 2009 plan and contracted services costs to assist in the reorganization of our business support functions
under the fiscal 2008 plan. During fiscal year 2009, we incurred $41 million and $34 million under these plans,
respectively, primarily for employee-related expenses under the fiscal 2009 plan and facilities-related expenses
under the fiscal 2008 plan.
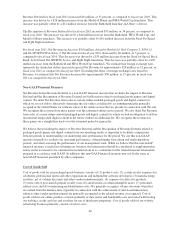
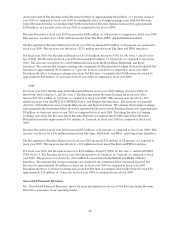
Amortization of Intangibles
Amortization of intangibles for fiscal years 2010 and 2009 was as follows (in millions):
March 31,
2010
% of Net
Revenue
March 31,
2009
% of Net
Revenue $ Change % Change
$53 1% $58 1% $(5) (9%)
Amortization of intangibles decreased by $5 million, or 9 percent, in fiscal year 2010, as compared to fiscal year
2009, primarily due to a change in the estimated useful lives of certain intangibles. This decrease is partially
offset by the amortization of intangibles related to our acquisition of Playfish.
Acquired In-Process Technology
Prior to the adoption of FASB ASC 805, Business Combinations, upon consummation of an acquisition, we
generally incurred a charge for the related acquired in-process technology, as reflected in our Consolidated
Statements of Operations. The development of a majority of the projects for which we incurred an acquired-in
process technology charge in connection with our acquisition of VG Holding Corp. (“VGH”) were either
completed or did not reach technological feasibility and therefore were abandoned. As of March 31, 2010, we
had one project in connection with our acquisition of VGH that continued to be in-process.
48