Electronic Arts 2011 Annual Report Download - page 161
Download and view the complete annual report
Please find page 161 of the 2011 Electronic Arts annual report below. You can navigate through the pages in the report by either clicking on the pages listed below, or by using the keyword search tool below to find specific information within the annual report.-
 1
1 -
2
-
3
-
4
-
5
-
6
-
7
-
8
-
9
-
10
-
11
-
12
-
13
-
14
-
15
-
16
-
17
-
18
-
19
-
20
-
21
-
22
-
23
-
24
-
25
-
26
-
27
-
28
-
29
-
30
-
31
-
32
-
33
-
34
-
35
-
36
-
37
-
38
-
39
-
40
-
41
-
42
-
43
-
44
-
45
-
46
-
47
-
48
-
49
-
50
-
51
-
52
-
53
-
54
-
55
-
56
-
57
-
58
-
59
-
60
-
61
-
62
-
63
-
64
-
65
-
66
-
67
-
68
-
69
-
70
-
71
-
72
-
73
-
74
-
75
-
76
-
77
-
78
-
79
-
80
-
81
-
82
-
83
-
84
-
85
-
86
-
87
-
88
-
89
-
90
-
91
-
92
-
93
-
94
-
95
-
96
-
97
-
98
-
99
-
100
-
101
-
102
-
103
-
104
-
105
-
106
-
107
-
108
-
109
-
110
-
111
-
112
-
113
-
114
-
115
-
116
-
117
-
118
-
119
-
120
-
121
-
122
-
123
-
124
-
125
-
126
-
127
-
128
-
129
-
130
-
131
-
132
-
133
-
134
-
135
-
136
-
137
-
138
-
139
-
140
-
141
-
142
-
143
-
144
-
145
-
146
-
147
-
148
-
149
-
150
-
 151
151 -
 152
152 -
 153
153 -
 154
154 -
 155
155 -
 156
156 -
 157
157 -
 158
158 -
 159
159 -
 160
160 -
 161
161 -
 162
162 -
 163
163 -
 164
164 -
 165
165 -
 166
166 -
 167
167 -
 168
168 -
 169
169 -
 170
170 -
 171
171 -
172
-
173
-
174
-
175
-
176
-
177
-
178
-
179
-
180
-
181
-
182
-
183
-
184
-
185
-
186
-
187
-
188
-
189
-
190
-
191
-
192
 |
 |

Annual Report
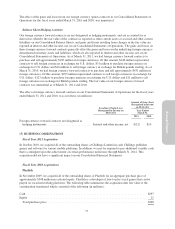
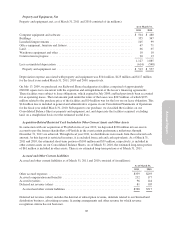
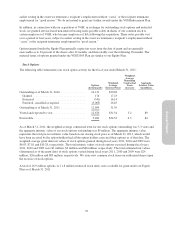
Property and Equipment, Net
Property and equipment, net, as of March 31, 2011 and 2010 consisted of (in millions):
As of March 31,
2011 2010
Computer equipment and software ................................................ $ 504 $ 480
Buildings .................................................................... 355 347
Leasehold improvements ........................................................ 105 99
Office equipment, furniture and fixtures ............................................ 67 71
Land ........................................................................ 66 65
Warehouse equipment and other .................................................. 10 10
Construction in progress ........................................................ 20 13
1,127 1,085
Less accumulated depreciation ................................................... (614) (548)
Property and equipment, net ................................................... $ 513 $ 537
Depreciation expense associated with property and equipment was $104 million, $123 million and $117 million
for the fiscal years ended March 31, 2011, 2010 and 2009, respectively.
On July 13, 2009, we purchased our Redwood Shores headquarters facilities comprised of approximately
660,000 square feet concurrent with the expiration and extinguishment of the lessor’s financing agreements.
These facilities were subject to lease obligations, which expired in July 2009, and had previously been accounted
for as operating leases. The total amount paid under the terms of the leases was $247 million, of which $233
million related to the purchase price of the facilities and $14 million was for the loss on our lease obligation. This
$14 million loss is included in general and administrative expense in our Consolidated Statements of Operations
for the fiscal year ended March 31, 2010. Subsequent to our purchase, we classified the facilities on our
Consolidated Balance Sheet as property and equipment, net, and depreciate the facilities acquired, excluding
land, on a straight-line basis over the estimated useful lives.
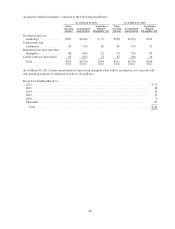
Acquisition-Related Restricted Cash Included in Other Current Assets and Other Assets
In connection with our acquisition of Playfish in fiscal year 2010, we deposited $100 million into an escrow
account to pay the former shareholders of Playfish in the event certain performance milestones through
December 31, 2011 are achieved. Through fiscal year 2011, no distributions were made from the restricted cash
amount. As this deposit is restricted in nature, it is excluded from cash and cash equivalents. As of March 31,
2011 and 2010, the estimated short-term portion of $100 million and $39 million, respectively, is included in
other current assets on our Consolidated Balance Sheets. As of March 31, 2010, the estimated long-term portion
of $61 million is included in other assets. There is no estimated long-term portion as of March 31, 2011.
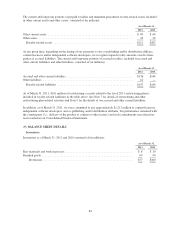
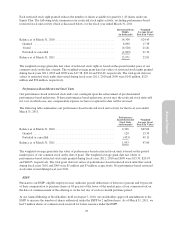
Accrued and Other Current Liabilities
Accrued and other current liabilities as of March 31, 2011 and 2010 consisted of (in millions):
As of March 31,
2011 2010
Other accrued expenses ....................................................... $359 $293
Accrued compensation and benefits ............................................. 232 177
Accrued royalties ............................................................ 96 144
Deferred net revenue (other) ................................................... 81 103
Accrued and other current liabilities ........................................... $768 $717
Deferred net revenue (other) includes the deferral of subscription revenue, deferrals related to our Switzerland
distribution business, advertising revenue, licensing arrangements and other revenue for which revenue
recognition criteria has not been met.
85