Electronic Arts 2011 Annual Report Download - page 170
Download and view the complete annual report
Please find page 170 of the 2011 Electronic Arts annual report below. You can navigate through the pages in the report by either clicking on the pages listed below, or by using the keyword search tool below to find specific information within the annual report.-
 1
1 -
2
-
3
-
4
-
5
-
6
-
7
-
8
-
9
-
10
-
11
-
12
-
13
-
14
-
15
-
16
-
17
-
18
-
19
-
20
-
21
-
22
-
23
-
24
-
25
-
26
-
27
-
28
-
29
-
30
-
31
-
32
-
33
-
34
-
35
-
36
-
37
-
38
-
39
-
40
-
41
-
42
-
43
-
44
-
45
-
46
-
47
-
48
-
49
-
50
-
51
-
52
-
53
-
54
-
55
-
56
-
57
-
58
-
59
-
60
-
61
-
62
-
63
-
64
-
65
-
66
-
67
-
68
-
69
-
70
-
71
-
72
-
73
-
74
-
75
-
76
-
77
-
78
-
79
-
80
-
81
-
82
-
83
-
84
-
85
-
86
-
87
-
88
-
89
-
90
-
91
-
92
-
93
-
94
-
95
-
96
-
97
-
98
-
99
-
100
-
101
-
102
-
103
-
104
-
105
-
106
-
107
-
108
-
109
-
110
-
111
-
112
-
113
-
114
-
115
-
116
-
117
-
118
-
119
-
120
-
121
-
122
-
123
-
124
-
125
-
126
-
127
-
128
-
129
-
130
-
131
-
132
-
133
-
134
-
135
-
136
-
137
-
138
-
139
-
140
-
141
-
142
-
143
-
144
-
145
-
146
-
147
-
148
-
149
-
150
-
151
-
152
-
153
-
154
-
155
-
156
-
157
-
158
-
159
-
 160
160 -
 161
161 -
 162
162 -
 163
163 -
 164
164 -
 165
165 -
 166
166 -
 167
167 -
 168
168 -
 169
169 -
 170
170 -
 171
171 -
 172
172 -
 173
173 -
 174
174 -
 175
175 -
 176
176 -
 177
177 -
 178
178 -
 179
179 -
 180
180 -
181
-
182
-
183
-
184
-
185
-
186
-
187
-
188
-
189
-
190
-
191
-
192
 |
 |

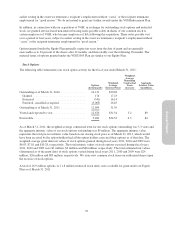
The following table summarizes outstanding and exercisable stock options as of March 31, 2011:
Options Outstanding Options Exercisable
Range of
Exercise Prices
Number
of Shares
(in thousands)
Weighted-
Average
Remaining
Contractual
Term (in years)
Weighted-
Average
Exercise
Prices
Potential
Dilution
Number
of Shares
(in thousands)
Weighted-
Average
Exercise
Prices
Potential
Dilution
$0.65 - $19.99 3,477 7.57 $17.06 1.0% 1,618 $16.95 0.5%
20.00 - 39.99 5,479 4.21 24.45 1.7% 4,353 25.31 1.3%
40.00 - 59.99 3,206 5.07 51.15 1.0% 2,773 51.23 0.8%
60.00 - 65.93 737 2.97 64.68 0.2% 737 64.68 0.2%
$0.65 - $65.93 12,899 5.26 31.39 3.9% 9,481 34.52 2.8%
Potential dilution is computed by dividing the options in the related range of exercise prices by 333 million
shares of common stock, which were issued and outstanding as of March 31, 2011.
At our Annual Meeting of Stockholders, held on August 5, 2010, our stockholders approved amendments to the
Equity Plan to (1) increase the number of shares authorized for issuance under the Equity Plan by 5.3 million
shares and (2) remove the provision that provides for automatic grants to our non-employee directors upon
appointment to the Board of Directors and annually upon re-election.
Restricted Stock Rights
We grant restricted stock rights under our Equity Plan to employees worldwide (except in certain countries where
doing so is not feasible due to local legal requirements). Restricted stock units entitle holders to receive shares of
common stock at the end of a specified period of time. Upon vesting, the equivalent number of common shares is
typically issued net of required tax withholdings, if any. Restricted stock is issued and outstanding upon grant;
however, restricted stock award holders are restricted from selling the shares until they vest. Upon granting or
vesting of restricted stock, as the case may be, we will typically withhold shares to satisfy tax withholding
requirements. Restricted stock rights are subject to forfeiture and transfer restrictions. Vesting for restricted stock
rights is based on the holders’ continued employment with us. If the vesting conditions are not met, unvested
restricted stock rights will be forfeited. Generally, our restricted stock rights vest according to one of the
following vesting schedules:
• Three-year vesting with 33.33 percent cliff vesting at the end of each of the first and second years, and
33.34 percent cliff vesting at the end of the third year;
• Four-year vesting with 25 percent cliff vesting at the end of each year;
• Three-year vesting with 25 percent cliff vesting at the end of each of the first and second years, and 50
percent cliff vesting at the end of the third year;
• 26 month vesting with 50 percent cliff vesting at the end of 13 months and 50 percent cliff vesting at the
end of 26 months; or
• 100 percent after one year.
94