Electronic Arts 2011 Annual Report Download - page 114
Download and view the complete annual report
Please find page 114 of the 2011 Electronic Arts annual report below. You can navigate through the pages in the report by either clicking on the pages listed below, or by using the keyword search tool below to find specific information within the annual report.-
 1
1 -
2
-
3
-
4
-
5
-
6
-
7
-
8
-
9
-
10
-
11
-
12
-
13
-
14
-
15
-
16
-
17
-
18
-
19
-
20
-
21
-
22
-
23
-
24
-
25
-
26
-
27
-
28
-
29
-
30
-
31
-
32
-
33
-
34
-
35
-
36
-
37
-
38
-
39
-
40
-
41
-
42
-
43
-
44
-
45
-
46
-
47
-
48
-
49
-
50
-
51
-
52
-
53
-
54
-
55
-
56
-
57
-
58
-
59
-
60
-
61
-
62
-
63
-
64
-
65
-
66
-
67
-
68
-
69
-
70
-
71
-
72
-
73
-
74
-
75
-
76
-
77
-
78
-
79
-
80
-
81
-
82
-
83
-
84
-
85
-
86
-
87
-
88
-
89
-
90
-
91
-
92
-
93
-
94
-
95
-
96
-
97
-
98
-
99
-
100
-
101
-
102
-
103
-
 104
104 -
 105
105 -
 106
106 -
 107
107 -
 108
108 -
 109
109 -
 110
110 -
 111
111 -
 112
112 -
 113
113 -
 114
114 -
 115
115 -
 116
116 -
 117
117 -
 118
118 -
 119
119 -
 120
120 -
 121
121 -
 122
122 -
 123
123 -
 124
124 -
125
-
126
-
127
-
128
-
129
-
130
-
131
-
132
-
133
-
134
-
135
-
136
-
137
-
138
-
139
-
140
-
141
-
142
-
143
-
144
-
145
-
146
-
147
-
148
-
149
-
150
-
151
-
152
-
153
-
154
-
155
-
156
-
157
-
158
-
159
-
160
-
161
-
162
-
163
-
164
-
165
-
166
-
167
-
168
-
169
-
170
-
171
-
172
-
173
-
174
-
175
-
176
-
177
-
178
-
179
-
180
-
181
-
182
-
183
-
184
-
185
-
186
-
187
-
188
-
189
-
190
-
191
-
192
 |
 |

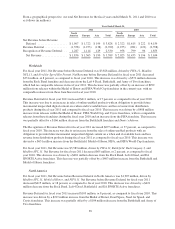
From a geographical perspective, our total Net Revenue for the fiscal years ended March 31, 2011 and 2010 was
as follows (in millions):
Year Ended March 31,
2011 2010
North
America Europe Asia Total
North
America Europe Asia Total
Net Revenue before Revenue
Deferral .................... $1,907 $ 1,722 $ 199 $ 3,828 $ 2,322 $1,615 $ 222 $ 4,159
Revenue Deferral ............... (1,358) (1,273) (138) (2,769) (1,255) (981) (122) (2,358)
Recognition of Revenue Deferral . . 1,287 1,114 129 2,530 958 799 96 1,853
Net Revenue ................. $1,836 $ 1,563 $ 190 $ 3,589 $ 2,025 $1,433 $ 196 $ 3,654
Worldwide
For fiscal year 2011, Net Revenue before Revenue Deferral was $3,828 million, driven by FIFA 11,Madden
NFL 11, and Need for Speed Hot Pursuit. Net Revenue before Revenue Deferral for fiscal year 2011 decreased
$331 million, or 8 percent, as compared to fiscal year 2010. This decrease was driven by a $572 million decrease
from the Rock Band franchise and decreases from the Left 4 Dead, Battlefield, and Army of Two franchises,
which had no comparable releases in fiscal year 2011. This decrease was partially offset by an increase of $292
million from releases within the Medal of Honor and FIFA World Cup franchises in the current year, with no
comparable releases from these franchises in fiscal year 2010.
Revenue Deferral for fiscal year 2011 increased $411 million, or 17 percent, as compared to fiscal year 2010.
This increase was due to an increase in sales of online-enabled products with an obligation to provide future
incremental unspecified digital content on a when and if available basis and less revenue from distribution
products during fiscal year 2011 and compared to fiscal year 2010. This increase was driven by a $488 million
increase from releases within the Medal of Honor, FIFA World Cup, and Crysis franchises, with no comparable
releases from these franchises during the fiscal year 2010 and an increase from the FIFA franchise. This increase
was partially offset by a $166 million decrease from the Battlefield franchise and Dante’s Inferno.
The Recognition of Revenue Deferral for fiscal year 2011 increased $677 million, or 37 percent, as compared to
fiscal year 2010. This increase was due to an increase from the sales of online-enabled products with an
obligation to provide future incremental unspecified digital content on a when and if available basis and less
revenue from distribution products during fiscal year 2011 as compared to fiscal year 2010. This increase was
driven by a $631 million increase from the Battlefield, Medal of Honor, FIFA, and FIFA World Cup franchises.
For fiscal year 2011, Net Revenue was $3,589 million, driven by FIFA 11,Battlefield: Bad Company 2, and
Madden NFL 11. Net Revenue for fiscal year 2011 decreased $65 million, or 2 percent, as compared to fiscal
year 2010. This decrease was driven by a $481 million decrease from the Rock Band, Left 4 Dead, and EA
SPORTS Active franchises. This decrease was partially offset by a $403 million increase from the Battlefield and
Medal of Honor franchises.
North America
For fiscal year 2011, Net Revenue before Revenue Deferral in North America was $1,907 million, driven by
Madden NFL 11, Medal of Honor, and FIFA 11. Net Revenue before Revenue Deferral for fiscal year 2011
decreased $415 million, or 18 percent, as compared to fiscal year 2010. This decrease was driven by a $421
million decrease from the Rock Band, Left 4 Dead, Battlefield, and EA SPORTS Active franchises.
Revenue Deferral for fiscal year 2011 increased $103 million, or 8 percent, as compared to fiscal year 2010. This
increase was driven by a $219 million increase from the Medal of Honor, Dead Space, Need for Speed, and
Crysis franchises. This increase was partially offset by a $104 million decrease from the Battlefield and Army of
Two franchises.
38