Electronic Arts 2011 Annual Report Download - page 127
Download and view the complete annual report
Please find page 127 of the 2011 Electronic Arts annual report below. You can navigate through the pages in the report by either clicking on the pages listed below, or by using the keyword search tool below to find specific information within the annual report.-
 1
1 -
2
-
3
-
4
-
5
-
6
-
7
-
8
-
9
-
10
-
11
-
12
-
13
-
14
-
15
-
16
-
17
-
18
-
19
-
20
-
21
-
22
-
23
-
24
-
25
-
26
-
27
-
28
-
29
-
30
-
31
-
32
-
33
-
34
-
35
-
36
-
37
-
38
-
39
-
40
-
41
-
42
-
43
-
44
-
45
-
46
-
47
-
48
-
49
-
50
-
51
-
52
-
53
-
54
-
55
-
56
-
57
-
58
-
59
-
60
-
61
-
62
-
63
-
64
-
65
-
66
-
67
-
68
-
69
-
70
-
71
-
72
-
73
-
74
-
75
-
76
-
77
-
78
-
79
-
80
-
81
-
82
-
83
-
84
-
85
-
86
-
87
-
88
-
89
-
90
-
91
-
92
-
93
-
94
-
95
-
96
-
97
-
98
-
99
-
100
-
101
-
102
-
103
-
104
-
105
-
106
-
107
-
108
-
109
-
110
-
111
-
112
-
113
-
114
-
115
-
116
-
 117
117 -
 118
118 -
 119
119 -
 120
120 -
 121
121 -
 122
122 -
 123
123 -
 124
124 -
 125
125 -
 126
126 -
 127
127 -
 128
128 -
 129
129 -
 130
130 -
 131
131 -
 132
132 -
 133
133 -
 134
134 -
 135
135 -
 136
136 -
 137
137 -
138
-
139
-
140
-
141
-
142
-
143
-
144
-
145
-
146
-
147
-
148
-
149
-
150
-
151
-
152
-
153
-
154
-
155
-
156
-
157
-
158
-
159
-
160
-
161
-
162
-
163
-
164
-
165
-
166
-
167
-
168
-
169
-
170
-
171
-
172
-
173
-
174
-
175
-
176
-
177
-
178
-
179
-
180
-
181
-
182
-
183
-
184
-
185
-
186
-
187
-
188
-
189
-
190
-
191
-
192
 |
 |

Annual Report
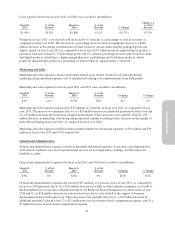
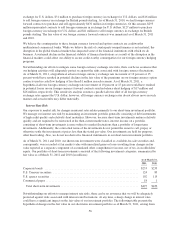
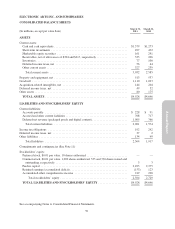
LIQUIDITY AND CAPITAL RESOURCES
As of
March 31, Increase /
(Decrease)(In millions) 2011 2010
Cash and cash equivalents ............................................ $1,579 $1,273 $ 306
Short-term investments ............................................... 497 432 65
Marketable equity securities ........................................... 161 291 (130)
Total ........................................................... $2,237 $1,996 $ 241
Percentage of total assets ........................................... 45% 43%
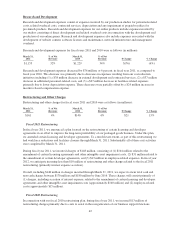
Year Ended
March 31, Increase /
(Decrease)(In millions) 2011 2010
Cash provided by operating activities ................................... $ 320 $ 152 $168
Cash used in investing activities ....................................... (15) (572) 557
Cash provided by (used in) financing activities ............................ (23) 53 (76)
Effect of foreign exchange on cash and cash equivalents .................... 24 19 5
Net increase (decrease) in cash and cash equivalents ..................... $ 306 $ (348) $ 654
Changes in Cash Flow
Operating Activities. During fiscal year 2011, we generated $320 million of cash from operating activities as
compared to generating $152 million in fiscal year 2010. The increase in cash provided by operating activities in
fiscal year 2011 as compared to fiscal year 2010 was primarily due to (1) a greater percentage of net revenue
from EA studio and digital products, which have higher margins than our co-publishing and distribution
products, (2) the timing of payments related to our inventory purchases, (3) our cost reduction initiatives,
including decreases in external development and contracted services, and (4) lower marketing and advertising
spend as a result of a decrease in the number of titles released as compared to the prior year.
Investing Activities. Cash used in investing activities decreased $557 million during the fiscal year ended
March 31, 2011 as compared to the fiscal year ended March 31, 2010 primarily due to (1) a $267 million
decrease in cash used for acquisitions, primarily from Playfish during the fiscal year ended March 31, 2010, (2) a
$246 million decrease in capital expenditures, of which $233 million was used to purchase our Redwood Shores
headquarters facilities during the fiscal year ended March 31, 2010, (3) $121 million in proceeds received from
the sale of our Ubisoft investment, (4) $100 million in acquisition-related restricted cash for contingent
consideration in connection with our acquisition of Playfish in fiscal year 2010, and (5) a $97 million decrease in
purchases of short-term investments. These decreases were partially offset by $268 million of lower proceeds
received from maturities and sales of short-term investments.
Financing Activities. Cash provided by financing activities decreased $76 million during the fiscal year ended
March 31, 2011 as compared to the fiscal year ended March 31, 2010 primarily due to $58 million, net of
commissions, cash paid for the repurchase and retirement of our common stock.
Short-term Investments and Marketable Equity Securities
Due to our mix of fixed and variable rate securities, our short-term investment portfolio is susceptible to changes
in short-term interest rates. As of March 31, 2011, the gross unrealized gains and losses on our short-term
investments were immaterial and each were less than 1 percent of the total in short-term investments. From time
to time, we may liquidate some or all of our short-term investments to fund operational needs or other activities,
such as capital expenditures, business combinations or stock repurchase programs. Depending on which short-
term investments we liquidate to fund these activities, we could recognize a portion, or all, of the gross
unrealized gains or losses.
51