Electronic Arts 2011 Annual Report Download - page 151
Download and view the complete annual report
Please find page 151 of the 2011 Electronic Arts annual report below. You can navigate through the pages in the report by either clicking on the pages listed below, or by using the keyword search tool below to find specific information within the annual report.-
 1
1 -
2
-
3
-
4
-
5
-
6
-
7
-
8
-
9
-
10
-
11
-
12
-
13
-
14
-
15
-
16
-
17
-
18
-
19
-
20
-
21
-
22
-
23
-
24
-
25
-
26
-
27
-
28
-
29
-
30
-
31
-
32
-
33
-
34
-
35
-
36
-
37
-
38
-
39
-
40
-
41
-
42
-
43
-
44
-
45
-
46
-
47
-
48
-
49
-
50
-
51
-
52
-
53
-
54
-
55
-
56
-
57
-
58
-
59
-
60
-
61
-
62
-
63
-
64
-
65
-
66
-
67
-
68
-
69
-
70
-
71
-
72
-
73
-
74
-
75
-
76
-
77
-
78
-
79
-
80
-
81
-
82
-
83
-
84
-
85
-
86
-
87
-
88
-
89
-
90
-
91
-
92
-
93
-
94
-
95
-
96
-
97
-
98
-
99
-
100
-
101
-
102
-
103
-
104
-
105
-
106
-
107
-
108
-
109
-
110
-
111
-
112
-
113
-
114
-
115
-
116
-
117
-
118
-
119
-
120
-
121
-
122
-
123
-
124
-
125
-
126
-
127
-
128
-
129
-
130
-
131
-
132
-
133
-
134
-
135
-
136
-
137
-
138
-
139
-
140
-
 141
141 -
 142
142 -
 143
143 -
 144
144 -
 145
145 -
 146
146 -
 147
147 -
 148
148 -
 149
149 -
 150
150 -
 151
151 -
 152
152 -
 153
153 -
 154
154 -
 155
155 -
 156
156 -
 157
157 -
 158
158 -
 159
159 -
 160
160 -
 161
161 -
162
-
163
-
164
-
165
-
166
-
167
-
168
-
169
-
170
-
171
-
172
-
173
-
174
-
175
-
176
-
177
-
178
-
179
-
180
-
181
-
182
-
183
-
184
-
185
-
186
-
187
-
188
-
189
-
190
-
191
-
192
 |
 |

Annual Report
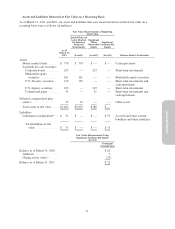
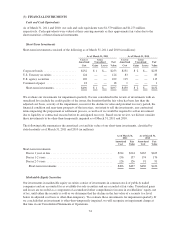
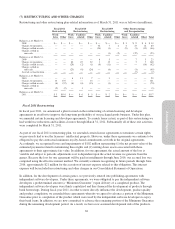
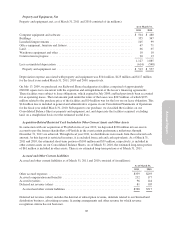
Marketable equity securities consisted of the following as of March 31, 2011 and 2010 (in millions):
Adjusted
Cost
Gross
Unrealized
Gains
Gross
Unrealized
Losses
Fair
Value
As of March 31, 2011 ........................................ $ 32 $129 $— $161
As of March 31, 2010 ........................................ $132 $159 $— $291
In May 2007, we entered into a licensing agreement with, and made a strategic equity investment in The9
Limited, a leading online game operator in China. We purchased approximately 15 percent of the outstanding
common shares (representing 15 percent of the voting rights at that time) of The9 for approximately $167
million. We began selling this investment in fiscal year 2010 and sold the remaining portion in fiscal year 2011.
During the fiscal years ended March 31, 2011 and 2010, we received proceeds of $11 million and $17 million,
respectively, from the sale of this investment and realized losses of $3 million and less than $1 million,
respectively. The realized losses for the fiscal years ended March 31, 2011 and 2010 are included in gains
(losses) on strategic investments, net, in our Consolidated Statements of Operations. We did not sell any of our
marketable equity securities during the fiscal year ended March 31, 2009.
In April 2007, we expanded our commercial agreements with, and made strategic equity investments in, Neowiz
Corporation and a related online gaming company, Neowiz Games. We refer to Neowiz Corporation and Neowiz
Games collectively as “Neowiz.” Based in Korea, Neowiz is an online media and gaming company with which
we partnered in 2006 to launch EA SPORTS FIFA Online in Korea. We purchased 15 percent of the then-
outstanding common shares (representing 15 percent of the voting rights at that time) of Neowiz Corporation and
15 percent of the then-outstanding common shares (representing 15 percent of the voting rights at the time) of
Neowiz Games, for approximately $83 million. As discussed below, we also purchased preferred shares of
Neowiz, which were classified as other assets on our Consolidated Balance Sheet as of March 31, 2010. During
the fourth quarter of fiscal year 2011, we exercised our option to convert all of the preferred shares to common
shares.
In February 2005, we purchased approximately 19.9 percent of the then-outstanding ordinary shares
(representing approximately 18 percent of the voting rights at the time) of Ubisoft Entertainment (“Ubisoft”) for
$91 million. As of March 31, 2010, we owned approximately 15 percent of the outstanding shares of Ubisoft
(representing approximately 13 percent of the voting rights). During the fiscal year ended March 31, 2011, we
sold our investment in Ubisoft and received proceeds of $121 million and realized a gain of $28 million, net of
costs to sell. The realized gain is included in gains (losses) on strategic investments, net, in our Consolidated
Statements of Operations.
During the fiscal years 2011, 2010 and 2009, we recognized impairment charges of $2 million, $26 million, and
$27 million, respectively, on our investment in The9. During fiscal year 2009, we recognized impairment charges
of $30 million, on our Neowiz common shares. We did not recognize any impairment charges on our Neowiz
common shares during the fiscal years ended March 31, 2011 and 2010. Due to various factors, including but not
limited to, the extent and duration during which the market prices of these securities had been below adjusted
cost and our intent to hold certain securities, we concluded the decline in values were other-than-temporary. In
fiscal year 2009, we received a cash dividend of $5 million from The9, offsetting our $27 million impairment
charge. The $2 million, $26 million, and $57 million impairments for the fiscal years ended March 31, 2011,
2010 and 2009, respectively, are included in gains (losses) on strategic investments, net, in our Consolidated
Statements of Operations.
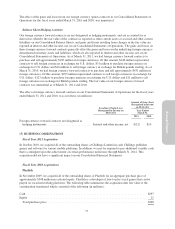
Other Investments Included in Other Assets
In April 2007, we purchased all of the then-outstanding non-voting preferred shares of Neowiz, whose common
stock is publicly traded, for approximately $27 million and included it in other assets on our Consolidated
Balance Sheet as of March 31, 2010. These investments were accounted for under the cost method. Under this
method, the investments were recorded at cost until we determined that the fair value of the investment had fallen
below its adjusted cost basis and such decline was other-than-temporary. When we conclude that an investment is
75