Electronic Arts 2011 Annual Report Download - page 136
Download and view the complete annual report
Please find page 136 of the 2011 Electronic Arts annual report below. You can navigate through the pages in the report by either clicking on the pages listed below, or by using the keyword search tool below to find specific information within the annual report.-
 1
1 -
2
-
3
-
4
-
5
-
6
-
7
-
8
-
9
-
10
-
11
-
12
-
13
-
14
-
15
-
16
-
17
-
18
-
19
-
20
-
21
-
22
-
23
-
24
-
25
-
26
-
27
-
28
-
29
-
30
-
31
-
32
-
33
-
34
-
35
-
36
-
37
-
38
-
39
-
40
-
41
-
42
-
43
-
44
-
45
-
46
-
47
-
48
-
49
-
50
-
51
-
52
-
53
-
54
-
55
-
56
-
57
-
58
-
59
-
60
-
61
-
62
-
63
-
64
-
65
-
66
-
67
-
68
-
69
-
70
-
71
-
72
-
73
-
74
-
75
-
76
-
77
-
78
-
79
-
80
-
81
-
82
-
83
-
84
-
85
-
86
-
87
-
88
-
89
-
90
-
91
-
92
-
93
-
94
-
95
-
96
-
97
-
98
-
99
-
100
-
101
-
102
-
103
-
104
-
105
-
106
-
107
-
108
-
109
-
110
-
111
-
112
-
113
-
114
-
115
-
116
-
117
-
118
-
119
-
120
-
121
-
122
-
123
-
124
-
125
-
 126
126 -
 127
127 -
 128
128 -
 129
129 -
 130
130 -
 131
131 -
 132
132 -
 133
133 -
 134
134 -
 135
135 -
 136
136 -
 137
137 -
 138
138 -
 139
139 -
 140
140 -
 141
141 -
 142
142 -
 143
143 -
 144
144 -
 145
145 -
 146
146 -
147
-
148
-
149
-
150
-
151
-
152
-
153
-
154
-
155
-
156
-
157
-
158
-
159
-
160
-
161
-
162
-
163
-
164
-
165
-
166
-
167
-
168
-
169
-
170
-
171
-
172
-
173
-
174
-
175
-
176
-
177
-
178
-
179
-
180
-
181
-
182
-
183
-
184
-
185
-
186
-
187
-
188
-
189
-
190
-
191
-
192
 |
 |

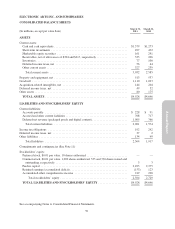
ELECTRONIC ARTS INC. AND SUBSIDIARIES
CONSOLIDATED STATEMENTS OF OPERATIONS
Year Ended March 31,
(In millions, except per share data) 2011 2010 2009
Net revenue .......................................................... $3,589 $3,654 $ 4,212
Cost of goods sold ..................................................... 1,499 1,866 2,127
Gross profit ........................................................ 2,090 1,788 2,085
Operating expenses:
Marketing and sales ................................................. 747 730 691
General and administrative ............................................ 301 320 332
Research and development ............................................ 1,153 1,229 1,359
Restructuring and other charges ........................................ 161 140 80
Amortization of intangibles ........................................... 57 53 58
Acquisition-related contingent consideration .............................. (17) 2 —
Goodwill impairment ................................................ — — 368
Certain abandoned acquisition-related costs ............................... — — 21
Acquired in-process technology ........................................ — — 3
Total operating expenses ............................................ 2,402 2,474 2,912
Operating loss .................................................... (312) (686) (827)
Gains (losses) on strategic investments, net ................................. 23 (26) (62)
Interest and other income, net ............................................ 10 6 34
Loss before provision for (benefit from) income taxes ...................... (279) (706) (855)
Provision for (benefit from) income taxes .................................. (3) (29) 233
Net loss ........................................................... $ (276) $ (677) $(1,088)
Net loss per share:
Basic and Diluted ................................................... $(0.84) $ (2.08) $ (3.40)
Number of shares used in computation:
Basic and Diluted ................................................... 330 325 320
See accompanying Notes to Consolidated Financial Statements.
60