Electronic Arts 2011 Annual Report Download - page 173
Download and view the complete annual report
Please find page 173 of the 2011 Electronic Arts annual report below. You can navigate through the pages in the report by either clicking on the pages listed below, or by using the keyword search tool below to find specific information within the annual report.-
 1
1 -
2
-
3
-
4
-
5
-
6
-
7
-
8
-
9
-
10
-
11
-
12
-
13
-
14
-
15
-
16
-
17
-
18
-
19
-
20
-
21
-
22
-
23
-
24
-
25
-
26
-
27
-
28
-
29
-
30
-
31
-
32
-
33
-
34
-
35
-
36
-
37
-
38
-
39
-
40
-
41
-
42
-
43
-
44
-
45
-
46
-
47
-
48
-
49
-
50
-
51
-
52
-
53
-
54
-
55
-
56
-
57
-
58
-
59
-
60
-
61
-
62
-
63
-
64
-
65
-
66
-
67
-
68
-
69
-
70
-
71
-
72
-
73
-
74
-
75
-
76
-
77
-
78
-
79
-
80
-
81
-
82
-
83
-
84
-
85
-
86
-
87
-
88
-
89
-
90
-
91
-
92
-
93
-
94
-
95
-
96
-
97
-
98
-
99
-
100
-
101
-
102
-
103
-
104
-
105
-
106
-
107
-
108
-
109
-
110
-
111
-
112
-
113
-
114
-
115
-
116
-
117
-
118
-
119
-
120
-
121
-
122
-
123
-
124
-
125
-
126
-
127
-
128
-
129
-
130
-
131
-
132
-
133
-
134
-
135
-
136
-
137
-
138
-
139
-
140
-
141
-
142
-
143
-
144
-
145
-
146
-
147
-
148
-
149
-
150
-
151
-
152
-
153
-
154
-
155
-
156
-
157
-
158
-
159
-
160
-
161
-
162
-
 163
163 -
 164
164 -
 165
165 -
 166
166 -
 167
167 -
 168
168 -
 169
169 -
 170
170 -
 171
171 -
 172
172 -
 173
173 -
 174
174 -
 175
175 -
 176
176 -
 177
177 -
 178
178 -
 179
179 -
 180
180 -
 181
181 -
 182
182 -
 183
183 -
184
-
185
-
186
-
187
-
188
-
189
-
190
-
191
-
192
 |
 |

Annual Report
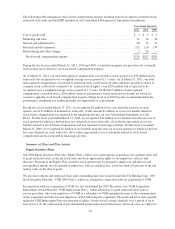
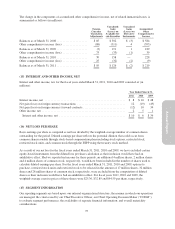
The change in the components of accumulated other comprehensive income, net of related immaterial taxes, is
summarized as follows (in millions):
Foreign
Currency
Translation
Adjustments
Unrealized
Gains
(Losses) on
Available-for-
sale Securities
Unrealized
Gains
(Losses) on
Derivative
Instruments
Accumulated
Other
Comprehensive
Income
Balances as of March 31, 2008 ..................... $85 $502 $ (3) $584
Other comprehensive income (loss) ................. (88) (311) 4 (395)
Balances as of March 31, 2009 ..................... (3) 191 1 189
Other comprehensive income (loss) ................. 73 (33) (1) 39
Balances as of March 31, 2010 ..................... 70 158 — 228
Other comprehensive income (loss) ................. 25 (32) (2) (9)
Balances as of March 31, 2011 ..................... $95 $126 $ (2) $219
(15) INTEREST AND OTHER INCOME, NET
Interest and other income, net, for the fiscal years ended March 31, 2011, 2010 and 2009 consisted of (in
millions):
Year Ended March 31,
2011 2010 2009
Interest income, net ....................................................... $ 8 $10 $48
Net gain (loss) on foreign currency transactions ................................. 12 (19) (49)
Net gain (loss) on foreign currency forward contracts ............................. (12) 10 34
Other income, net ......................................................... 2 5 1
Interest and other income, net ............................................. $10 $ 6 $34
(16) NET LOSS PER SHARE
Basic earnings per share is computed as net loss divided by the weighted-average number of common shares
outstanding for the period. Diluted earnings per share reflects the potential dilution that could occur from
common shares issuable through stock-based compensation plans including stock options, restricted stock,
restricted stock units, and common stock through the ESPP using the treasury stock method.
As a result of our net loss for the fiscal years ended March 31, 2011, 2010 and 2009, we have excluded certain
equity-based instruments from the diluted loss per share calculation as their inclusion would have had an
antidilutive effect. Had we reported net income for these periods, an additional 4 million shares, 2 million shares
and 4 million shares of common stock, respectively, would have been included in the number of shares used to
calculate diluted earnings per share. For the fiscal years ended March 31, 2011, 2010 and 2009, options to
purchase, restricted stock units and restricted stock to be released in the amount of 17 million shares, 32 million
shares and 28 million shares of common stock, respectively, were excluded from the computation of diluted
shares as their inclusion would have had an antidilutive effect. For fiscal years 2011, 2010 and 2009, the
weighted-average exercise prices of these shares were $25.36, $32.89 and $44.59 per share, respectively.
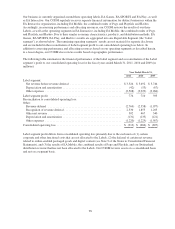
(17) SEGMENT INFORMATION
Our reporting segments are based upon: our internal organizational structure; the manner in which our operations
are managed; the criteria used by our Chief Executive Officer, our Chief Operating Decision Maker (“CODM”),
to evaluate segment performance; the availability of separate financial information; and overall materiality
considerations.
97