Electronic Arts 2011 Annual Report Download - page 52
Download and view the complete annual report
Please find page 52 of the 2011 Electronic Arts annual report below. You can navigate through the pages in the report by either clicking on the pages listed below, or by using the keyword search tool below to find specific information within the annual report.-
 1
1 -
2
-
3
-
4
-
5
-
6
-
7
-
8
-
9
-
10
-
11
-
12
-
13
-
14
-
15
-
16
-
17
-
18
-
19
-
20
-
21
-
22
-
23
-
24
-
25
-
26
-
27
-
28
-
29
-
30
-
31
-
32
-
33
-
34
-
35
-
36
-
37
-
38
-
39
-
40
-
41
-
 42
42 -
 43
43 -
 44
44 -
 45
45 -
 46
46 -
 47
47 -
 48
48 -
 49
49 -
 50
50 -
 51
51 -
 52
52 -
 53
53 -
 54
54 -
 55
55 -
 56
56 -
 57
57 -
 58
58 -
 59
59 -
 60
60 -
 61
61 -
 62
62 -
63
-
64
-
65
-
66
-
67
-
68
-
69
-
70
-
71
-
72
-
73
-
74
-
75
-
76
-
77
-
78
-
79
-
80
-
81
-
82
-
83
-
84
-
85
-
86
-
87
-
88
-
89
-
90
-
91
-
92
-
93
-
94
-
95
-
96
-
97
-
98
-
99
-
100
-
101
-
102
-
103
-
104
-
105
-
106
-
107
-
108
-
109
-
110
-
111
-
112
-
113
-
114
-
115
-
116
-
117
-
118
-
119
-
120
-
121
-
122
-
123
-
124
-
125
-
126
-
127
-
128
-
129
-
130
-
131
-
132
-
133
-
134
-
135
-
136
-
137
-
138
-
139
-
140
-
141
-
142
-
143
-
144
-
145
-
146
-
147
-
148
-
149
-
150
-
151
-
152
-
153
-
154
-
155
-
156
-
157
-
158
-
159
-
160
-
161
-
162
-
163
-
164
-
165
-
166
-
167
-
168
-
169
-
170
-
171
-
172
-
173
-
174
-
175
-
176
-
177
-
178
-
179
-
180
-
181
-
182
-
183
-
184
-
185
-
186
-
187
-
188
-
189
-
190
-
191
-
192
 |
 |

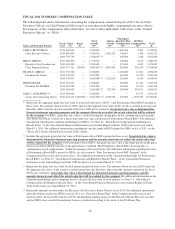
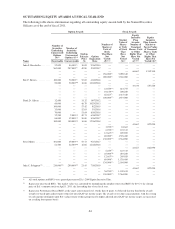
OUTSTANDING EQUITY AWARDS AT FISCAL YEAR-END
The following table shows information regarding all outstanding equity awards held by the Named Executive
Officers as of the end of fiscal 2011.
Option Awards Stock Awards
Name
Number of
Securities
Underlying
Unexercised
Options
(#)(1)
Number of
Securities
Underlying
Unexercised
Options (#)(1)
Option
Exercise
Price
($)
Option
Expiration
Date
Number of
Shares or
Units of
Stock
That Have
Not
Vested
(#)(1)(2)
Market
Value of
Shares
or Units
of Stock
That
Have
Not
Vested
($)(2)
Equity
Incentive
Plan
Awards:
Number of
Unearned
Shares, Units
or Other
Rights That
Have Not
Vested
(#)(1)(3)
Equity
Incentive
Plan Awards:
Market or
Payout Value
of Unearned
Shares, Units
or Other
Rights That
Have Not
Vested ($)(4)
Exercisable Unexercisable
John S. Riccitiello ........ 52,820 86,180(5) 18.85 9/16/2016 — — — —
563,000 287,000(6) 49.90 5/10/2017 — — — —
— — — — — — 66,667 1,315,340
— — — — 258,000(7) 5,090,340 — —
— — — — 200,000(8) 3,946,000 — —
Eric F. Brown ........... 180,000 70,000(9) 52.02 4/16/2018 — — — —
50,000 50,000(10) 16.06 12/16/2018 — — — —
— — — — — — 33,333 657,660
— — — — 41,650(11) 821,755 — —
— — — — 10,150(12) 200,260 — —
— — — — 66,667(7) 1,315,340 — —
— — — — 100,000(13) 1,973,000 — —
Frank D. Gibeau ......... 12,600 — 31.32 10/7/2012 — — — —
60,000 — 48.79 10/24/2013 — — — —
100,000 — 57.42 9/2/2015 — — — —
35,000 — 52.03 3/1/2016 — — — —
70,000 — 51.64 8/16/2016 — — — —
32,200 2,800(14) 49.71 6/18/2017 — — — —
88,000 12,000(15) 50.80 8/16/2017 — — — —
100,000 100,000(10) 16.06 12/16/2018 — — — —
— — — — — — 41,667 822,090
— — — — 1,250(16) 24,663 — —
— — — — 6,250(17) 123,313 — —
— — — — 12,667(18) 249,920 — —
— — — — 80,000(7) 1,578,400 — —
— — — — 130,000(13) 2,564,900 — —
Peter Moore ............ 301,000 49,000(19) 53.73 9/17/2017 — — — —
62,500 62,500(10) 16.06 12/16/2018 — — — —
— — — — — — 41,667 822,090
— — — — 6,250(17) 123,313 — —
— — — — 25,000(20) 493,250 — —
— — — — 12,667(18) 249,920 — —
— — — — 80,000(7) 1,578,400 — —
— — — — 130,000(13) 2,564,900 — —
John C. Schappert(21) ...... 210,000(22) 290,000(22) 21.45 7/16/2019 — — — —
— — — — — — 41,667 822,090
— — — — 56,250(23) 1,109,813 — —
— — — — 130,000(23) 2,564,900 — —
(1) All stock options and RSUs were granted pursuant to EA’s 2000 Equity Incentive Plan.
(2) Represents time-based RSUs. The market value was calculated by multiplying the number of unvested RSUs by $19.73, the closing
price of EA’s common stock on April 1, 2011, the last trading day of our fiscal year.
(3) Represents Performance-Based RSUs at the target achievement level. On the date of grant, we believed that one third of the awards
would vest based upon achievement of the first non-GAAP net income target. The awards vest in three equal amounts, with the vesting
of each amount contingent upon EA’s achievement of three progressively higher adjusted non-GAAP net income targets (as measured
on a trailing four-quarter basis).
44