Electronic Arts 2011 Annual Report Download - page 49
Download and view the complete annual report
Please find page 49 of the 2011 Electronic Arts annual report below. You can navigate through the pages in the report by either clicking on the pages listed below, or by using the keyword search tool below to find specific information within the annual report.-
 1
1 -
2
-
3
-
4
-
5
-
6
-
7
-
8
-
9
-
10
-
11
-
12
-
13
-
14
-
15
-
16
-
17
-
18
-
19
-
20
-
21
-
22
-
23
-
24
-
25
-
26
-
27
-
28
-
29
-
30
-
31
-
32
-
33
-
34
-
35
-
36
-
37
-
38
-
 39
39 -
 40
40 -
 41
41 -
 42
42 -
 43
43 -
 44
44 -
 45
45 -
 46
46 -
 47
47 -
 48
48 -
 49
49 -
 50
50 -
 51
51 -
 52
52 -
 53
53 -
 54
54 -
 55
55 -
 56
56 -
 57
57 -
 58
58 -
 59
59 -
60
-
61
-
62
-
63
-
64
-
65
-
66
-
67
-
68
-
69
-
70
-
71
-
72
-
73
-
74
-
75
-
76
-
77
-
78
-
79
-
80
-
81
-
82
-
83
-
84
-
85
-
86
-
87
-
88
-
89
-
90
-
91
-
92
-
93
-
94
-
95
-
96
-
97
-
98
-
99
-
100
-
101
-
102
-
103
-
104
-
105
-
106
-
107
-
108
-
109
-
110
-
111
-
112
-
113
-
114
-
115
-
116
-
117
-
118
-
119
-
120
-
121
-
122
-
123
-
124
-
125
-
126
-
127
-
128
-
129
-
130
-
131
-
132
-
133
-
134
-
135
-
136
-
137
-
138
-
139
-
140
-
141
-
142
-
143
-
144
-
145
-
146
-
147
-
148
-
149
-
150
-
151
-
152
-
153
-
154
-
155
-
156
-
157
-
158
-
159
-
160
-
161
-
162
-
163
-
164
-
165
-
166
-
167
-
168
-
169
-
170
-
171
-
172
-
173
-
174
-
175
-
176
-
177
-
178
-
179
-
180
-
181
-
182
-
183
-
184
-
185
-
186
-
187
-
188
-
189
-
190
-
191
-
192
 |
 |

Proxy Statement
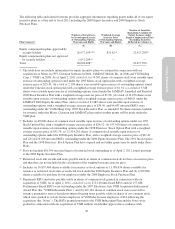
(5)
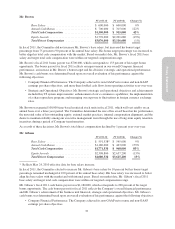
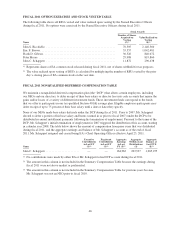
All Other Compensation Table
Name
Fiscal
Year
Basic Group
Term Life and
Disability
Premiums and
Executive
Physical Fees
($)
Company-
matching
401(k)
Contributions
($)(A)
Relocation-
Related
Costs ($)
Tax Gross-up
Related to
Relocation
Costs
($)
Other
($)
Total
($)
JOHN S. RICCITIELLO ........ 2011 2,501 — — — — 2,501
2010 1,308 — — — — 1,308
2009 1,308 — — — — 1,308
ERIC F. BROWN .............. 2011 4,070 — — — — 4,070
2010 3,645 — — 360(B) — 4,005
2009 1,199 — 420,459(C) 59,801 — 481,459
FRANK D. GIBEAU ........... 2011 1,296 11,025 — — — 12,321
2010 3,569 7,350 — — — 10,919
2009 1,308 6,900 — — — 8,208
PETER MOORE .............. 2011 1,296 11,025 — — — 12,321
2010 3,569 7,350 — — — 10,919
2009 4,114 6,900 287,941(D) 194,656 — 493,611
JOHN C. SCHAPPERT ......... 2011 1,296 11,025 — 3,396(E) — 15,717
2010 872 1,038 1,240,436(F) 736,210(G) — 1,978,556
(A) Amounts shown reflect company-matching 401(k) contributions for fiscal 2009, 2010 and 2011 that were each paid during the
subsequent fiscal year.
(B) Includes tax gross-up related to relocation costs incurred in fiscal 2009.
(C) Relocation-related costs for Mr. Brown in fiscal 2009 include costs of a house-hunting trip, temporary housing, home sale costs,
home purchase costs, storage, shipping of household goods and a miscellaneous relocation allowance.
(D) Relocation-related costs for Mr. Moore in fiscal 2009 include costs of a house-hunting trip, temporary housing, home sale costs,
home purchase costs, storage, shipping of household goods and a miscellaneous relocation allowance.
(E) Includes tax gross-up related to relocation costs incurred in fiscal 2010.
(F) Relocation-related compensation was provided to Mr. Schappert in fiscal 2010 as an incentive for him to join the Company and to
reimburse him for the costs resulting from that decision, including costs for a house-hunting trip, temporary housing, home sale
costs, home purchase costs, shipping of household goods and a miscellaneous relocation allowance. These costs include payments
related to the loss in value resulting from the sale of his home, measured as the difference between the original purchase price of the
home and the fair market value, assessed using independent appraisals, immediately prior to marketing the home for sale.
Mr. Schappert returned $247,201 of the relocation-related compensation paid by the Company upon his resignation pursuant to the
terms of Mr. Schappert’s Offer Letter dated June 15, 2009.
(G) Includes tax gross-up related to the loss on the sale of Mr. Schappert’s former home of $649,287.
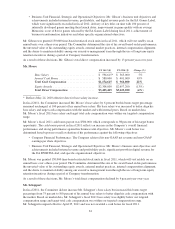
(6)
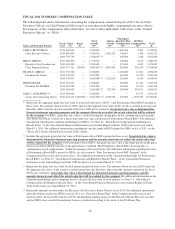
Represents the aggregate grant-date fair value of the target payout of Performance-Based RSUs granted to Mr. Riccitiello in
fiscal 2009 of $3,306,633, based on the probable outcome of the performance condition. At the time the Performance-Based
RSUs were granted, we believed that the threshold target (one-third of the maximum award of 200,000 RSUs) was probable
with vesting based upon the achievement of the first non-GAAP net income target. Assuming the highest level of performance
condition is achieved, the maximum grant-date fair value for the Performance-Based RSUs would be $9,920,000. No shares
have yet vested under the Performance-Based RSUs.
(7)
Represents the aggregate grant-date fair value of 83,300 time-based RSUs granted to Mr. Brown during fiscal 2009 of
$4,333,266 and the aggregate grant-date fair value of the target payout of the Performance-Based RSUs granted to Mr. Brown
in fiscal 2009 of $1,653,317, based on the probable outcome of the performance condition. At the time the Performance-Based
RSUs were granted, we believed that the threshold target (one-third of the maximum award of 100,000 RSUs) was probable
with vesting based upon the achievement of the first non-GAAP net income target. Assuming the highest level of performance
condition is achieved, the maximum grant-date fair value for the Performance-Based RSUs would be $4,960,000. No shares
have yet vested under the Performance-Based RSUs.
(8)
Represents the aggregate grant-date fair value of the 12,500 time-based RSUs granted to Mr. Gibeau in fiscal 2009 of
$588,250 and the aggregate grant-date fair value of the target payout of the Performance-Based RSUs granted to Mr. Gibeau
in fiscal 2009 of $2,066,634, based on the probable outcome of the performance condition. At the time the Performance-Based
RSUs were granted, we believed that the threshold target (one-third of the maximum award of 125,000 RSUs) was probable
with vesting based upon the achievement of the first non-GAAP net income target. Assuming the highest level of performance
condition is achieved, the maximum grant-date fair value for the Performance-Based RSUs would be $6,200,000. No shares
have yet vested under the Performance-Based RSUs.
41