Electronic Arts 2011 Annual Report Download - page 163
Download and view the complete annual report
Please find page 163 of the 2011 Electronic Arts annual report below. You can navigate through the pages in the report by either clicking on the pages listed below, or by using the keyword search tool below to find specific information within the annual report.-
 1
1 -
2
-
3
-
4
-
5
-
6
-
7
-
8
-
9
-
10
-
11
-
12
-
13
-
14
-
15
-
16
-
17
-
18
-
19
-
20
-
21
-
22
-
23
-
24
-
25
-
26
-
27
-
28
-
29
-
30
-
31
-
32
-
33
-
34
-
35
-
36
-
37
-
38
-
39
-
40
-
41
-
42
-
43
-
44
-
45
-
46
-
47
-
48
-
49
-
50
-
51
-
52
-
53
-
54
-
55
-
56
-
57
-
58
-
59
-
60
-
61
-
62
-
63
-
64
-
65
-
66
-
67
-
68
-
69
-
70
-
71
-
72
-
73
-
74
-
75
-
76
-
77
-
78
-
79
-
80
-
81
-
82
-
83
-
84
-
85
-
86
-
87
-
88
-
89
-
90
-
91
-
92
-
93
-
94
-
95
-
96
-
97
-
98
-
99
-
100
-
101
-
102
-
103
-
104
-
105
-
106
-
107
-
108
-
109
-
110
-
111
-
112
-
113
-
114
-
115
-
116
-
117
-
118
-
119
-
120
-
121
-
122
-
123
-
124
-
125
-
126
-
127
-
128
-
129
-
130
-
131
-
132
-
133
-
134
-
135
-
136
-
137
-
138
-
139
-
140
-
141
-
142
-
143
-
144
-
145
-
146
-
147
-
148
-
149
-
150
-
151
-
152
-
 153
153 -
 154
154 -
 155
155 -
 156
156 -
 157
157 -
 158
158 -
 159
159 -
 160
160 -
 161
161 -
 162
162 -
 163
163 -
 164
164 -
 165
165 -
 166
166 -
 167
167 -
 168
168 -
 169
169 -
 170
170 -
 171
171 -
 172
172 -
 173
173 -
174
-
175
-
176
-
177
-
178
-
179
-
180
-
181
-
182
-
183
-
184
-
185
-
186
-
187
-
188
-
189
-
190
-
191
-
192
 |
 |

Annual Report
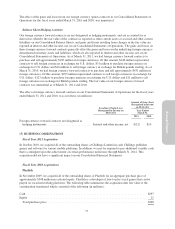
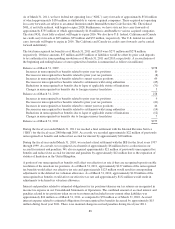
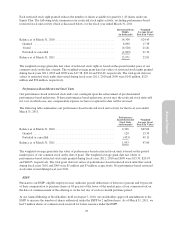
The differences between the statutory tax benefit rate and our effective tax expense (benefit) rate, expressed as a
percentage of loss before provision for (benefit from) income taxes, for the fiscal years ended March 31, 2011,
2010 and 2009 were as follows:
Year Ended March 31,
2011 2010 2009
Statutory federal benefit rate ............................................... (35.0%) (35.0%) (35.0%)
State taxes, net of federal benefit ............................................ (5.8%) (3.4%) (2.1%)
Differences between statutory rate and foreign effective tax rate ................... 12.3% 4.2% 2.6%
Valuation allowance ...................................................... 23.7% 17.2% 42.8%
Research and development credits ........................................... (2.4%) (1.1%) (1.6%)
Non-deductible acquisition-related costs and tax expense from integration
restructurings ......................................................... — 8.2% —
Non-deductible goodwill impairment ........................................ — — 13.6%
Differences between book and tax gain or loss on strategic investments ............. (8.6%) — 2.6%
Loss on facility impairment ................................................ — — 0.6%
Non-deductible stock-based compensation .................................... 12.1% 5.0% 3.7%
Other .................................................................. 2.6% 0.8% —
Effective tax expense (benefit) rate ........................................ (1.1%) (4.1%) 27.2%
Undistributed earnings of our foreign subsidiaries amounted to approximately $1,318 million as of March 31,
2011. Those earnings are considered to be indefinitely reinvested and, accordingly, no U.S. income taxes have
been provided thereon. Upon distribution of those earnings in the form of dividends or otherwise, we would be
subject to both U.S. income taxes (subject to an adjustment for foreign tax credits) and withholding taxes payable
to various foreign countries. It is not practicable to determine the income tax liability that might be incurred if
these earnings were to be distributed.
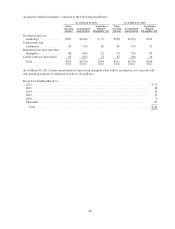
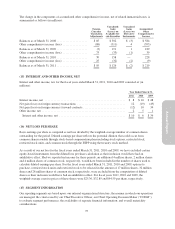
The components of net deferred tax assets, as of March 31, 2011 and 2010 consisted of (in millions):
As of March 31,
2011 2010
Deferred tax assets:
Accruals, reserves and other expenses ............................................. $178 $141
Tax credit carryforwards ....................................................... 181 188
Stock-based compensation ...................................................... 66 81
Amortization ................................................................ 12 16
Net operating loss & capital loss carryforwards ..................................... 234 233
Total ..................................................................... 671 659
Valuation allowance .......................................................... (515) (466)
Deferred tax assets, net of valuation allowance .................................... 156 193
Deferred tax liabilities:
Depreciation ................................................................. (7) (19)
State effect on federal taxes ..................................................... (56) (50)
Unrealized gain on marketable equity securities ..................................... (3) (19)
Prepaids and other liabilities .................................................... (27) (13)
Total ..................................................................... (93) (101)
Deferred tax assets, net of valuation allowance and deferred tax liabilities .............. $ 63 $ 92
The valuation allowance increased by $49 million in fiscal year 2011, primarily due to the increase in deferred
tax assets for U.S. tax losses and tax credits that are not currently considered to be more likely than not to be
realized.
87