Electronic Arts 2011 Annual Report Download - page 175
Download and view the complete annual report
Please find page 175 of the 2011 Electronic Arts annual report below. You can navigate through the pages in the report by either clicking on the pages listed below, or by using the keyword search tool below to find specific information within the annual report.-
 1
1 -
2
-
3
-
4
-
5
-
6
-
7
-
8
-
9
-
10
-
11
-
12
-
13
-
14
-
15
-
16
-
17
-
18
-
19
-
20
-
21
-
22
-
23
-
24
-
25
-
26
-
27
-
28
-
29
-
30
-
31
-
32
-
33
-
34
-
35
-
36
-
37
-
38
-
39
-
40
-
41
-
42
-
43
-
44
-
45
-
46
-
47
-
48
-
49
-
50
-
51
-
52
-
53
-
54
-
55
-
56
-
57
-
58
-
59
-
60
-
61
-
62
-
63
-
64
-
65
-
66
-
67
-
68
-
69
-
70
-
71
-
72
-
73
-
74
-
75
-
76
-
77
-
78
-
79
-
80
-
81
-
82
-
83
-
84
-
85
-
86
-
87
-
88
-
89
-
90
-
91
-
92
-
93
-
94
-
95
-
96
-
97
-
98
-
99
-
100
-
101
-
102
-
103
-
104
-
105
-
106
-
107
-
108
-
109
-
110
-
111
-
112
-
113
-
114
-
115
-
116
-
117
-
118
-
119
-
120
-
121
-
122
-
123
-
124
-
125
-
126
-
127
-
128
-
129
-
130
-
131
-
132
-
133
-
134
-
135
-
136
-
137
-
138
-
139
-
140
-
141
-
142
-
143
-
144
-
145
-
146
-
147
-
148
-
149
-
150
-
151
-
152
-
153
-
154
-
155
-
156
-
157
-
158
-
159
-
160
-
161
-
162
-
163
-
164
-
 165
165 -
 166
166 -
 167
167 -
 168
168 -
 169
169 -
 170
170 -
 171
171 -
 172
172 -
 173
173 -
 174
174 -
 175
175 -
 176
176 -
 177
177 -
 178
178 -
 179
179 -
 180
180 -
 181
181 -
 182
182 -
 183
183 -
 184
184 -
 185
185 -
186
-
187
-
188
-
189
-
190
-
191
-
192
 |
 |

Annual Report
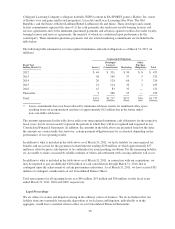
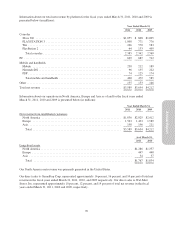
Information about our total net revenue by platform for the fiscal years ended March 31, 2011, 2010 and 2009 is
presented below (in millions):
Year Ended March 31,
2011 2010 2009
Consoles
Xbox 360 .......................................................... $1,055 $ 868 $1,005
PLAYSTATION 3 ................................................... 1,000 771 776
Wii ............................................................... 266 570 583
PlayStation 2 ....................................................... 64 133 405
Total consoles ..................................................... 2,385 2,342 2,769
PC .................................................................. 669 687 712
Mobile and handhelds
Mobile ............................................................ 230 212 189
Nintendo DS ........................................................ 96 135 222
PSP ............................................................... 74 125 174
Total mobile and handhelds .......................................... 400 472 585
Other ................................................................ 135 153 146
Total net revenue ...................................................... $3,589 $3,654 $4,212
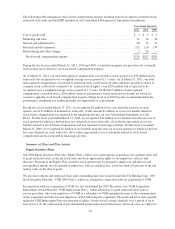
Information about our operations in North America, Europe and Asia as of and for the fiscal years ended
March 31, 2011, 2010 and 2009 is presented below (in millions):
Year Ended March 31,
2011 2010 2009
Net revenue from unaffiliated customers
North America ...................................................... $1,836 $2,025 $2,412
Europe ............................................................ 1,563 1,433 1,589
Asia ............................................................... 190 196 211
Total ............................................................ $3,589 $3,654 $4,212
As of March 31,
2011 2010
Long-lived assets
North America .............................................................. $1,286 $1,357
Europe .................................................................... 447 440
Asia ...................................................................... 34 37
Total ................................................................... $1,767 $1,834
Our North America net revenue was primarily generated in the United States.
Our direct sales to GameStop Corp. represented approximately 16 percent, 16 percent, and 14 percent of total net
revenue in the fiscal years ended March 31, 2011, 2010, and 2009 respectively. Our direct sales to Wal-Mart
Stores, Inc. represented approximately 10 percent, 12 percent, and 14 percent of total net revenue in the fiscal
years ended March 31, 2011, 2010 and 2009, respectively.
99