GE 2014 Annual Report Download - page 174
Download and view the complete annual report
Please find page 174 of the 2014 GE annual report below. You can navigate through the pages in the report by either clicking on the pages listed below, or by using the keyword search tool below to find specific information within the annual report.-
 1
1 -
2
-
3
-
4
-
5
-
6
-
7
-
8
-
9
-
10
-
11
-
12
-
13
-
14
-
15
-
16
-
17
-
18
-
19
-
20
-
21
-
22
-
23
-
24
-
25
-
26
-
27
-
28
-
29
-
30
-
31
-
32
-
33
-
34
-
35
-
36
-
37
-
38
-
39
-
40
-
41
-
42
-
43
-
44
-
45
-
46
-
47
-
48
-
49
-
50
-
51
-
52
-
53
-
54
-
55
-
56
-
57
-
58
-
59
-
60
-
61
-
62
-
63
-
64
-
65
-
66
-
67
-
68
-
69
-
70
-
71
-
72
-
73
-
74
-
75
-
76
-
77
-
78
-
79
-
80
-
81
-
82
-
83
-
84
-
85
-
86
-
87
-
88
-
89
-
90
-
91
-
92
-
93
-
94
-
95
-
96
-
97
-
98
-
99
-
100
-
101
-
102
-
103
-
104
-
105
-
106
-
107
-
108
-
109
-
110
-
111
-
112
-
113
-
114
-
115
-
116
-
117
-
118
-
119
-
120
-
121
-
122
-
123
-
124
-
125
-
126
-
127
-
128
-
129
-
130
-
131
-
132
-
133
-
134
-
135
-
136
-
137
-
138
-
139
-
140
-
141
-
142
-
143
-
144
-
145
-
146
-
147
-
148
-
149
-
150
-
151
-
152
-
153
-
154
-
155
-
156
-
157
-
158
-
159
-
160
-
161
-
162
-
163
-
 164
164 -
 165
165 -
 166
166 -
 167
167 -
 168
168 -
 169
169 -
 170
170 -
 171
171 -
 172
172 -
 173
173 -
 174
174 -
 175
175 -
 176
176 -
 177
177 -
 178
178 -
 179
179 -
 180
180 -
 181
181 -
 182
182 -
 183
183 -
 184
184 -
185
-
186
-
187
-
188
-
189
-
190
-
191
-
192
-
193
-
194
-
195
-
196
-
197
-
198
-
199
-
200
-
201
-
202
-
203
-
204
-
205
-
206
-
207
-
208
-
209
-
210
-
211
-
212
-
213
-
214
-
215
-
216
-
217
-
218
-
219
-
220
-
221
-
222
-
223
-
224
-
225
-
226
-
227
-
228
-
229
-
230
-
231
-
232
-
233
-
234
-
235
-
236
-
237
-
238
-
239
-
240
-
241
-
242
-
243
-
244
-
245
-
246
-
247
-
248
-
249
-
250
-
251
-
252
-
253
-
254
-
255
-
256
 |
 |

154 GE 2014 FORM 10-K
FINANCIAL STATEMENTS INVESTMENT SECURITIES
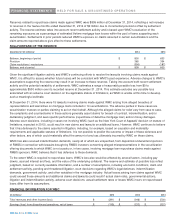
NOTE 3. INVESTMENT SECURITIES
Substantially all of our investment securities are classified as available-for-sale. These comprise mainly investment-grade debt
securities supporting obligations to annuitants, policyholders in our run-off insurance operations and supporting obligations to
holders of guaranteed investment contracts (GICs) in Trinity and investments held in our CLL business collateralized by senior
secured loans of high-quality, middle-market companies in a variety of industries. We do not have any securities classified as
held-to-maturity. 2014 2013
Gross Gross Gross Gross
Amortized unrealized unrealized Estimated Amortized unrealized unrealized Estimated
December 31 (In millions) cost gains losses fair value cost gains losses fair value
GE
Debt
U.S. corporate $ 12 $ - $ - $ 12 $ 21 $ 14 $ - $ 35
Corporate – non-U.S. 1 - - 1 13 - (1) 12
Equity
Available-for-sale 69 4 (2) 71 302 9 (41) 270
Trading - - - - 6 - - 6
82 4 (2) 84 342 23 (42) 323
GECC
Debt
U.S. corporate 19,889 3,967 (69) 23,787 19,600 2,323 (217) 21,706
State and municipal 5,181 624 (56) 5,749 4,245 235 (191) 4,289
Residential mortgage-backed(a) 1,578 153 (6) 1,725 1,819 139 (48) 1,910
Commercial mortgage-backed 2,903 170 (10) 3,063 2,929 188 (82) 3,035
Asset-backed 8,084 9 (175) 7,918 7,373 60 (46) 7,387
Corporate – non-U.S. 1,380 126 (30) 1,476 1,741 103 (86) 1,758
Government – non-U.S. 1,646 152 (2) 1,796 2,336 81 (7) 2,410
U.S. government and federal
agency 1,957 56 - 2,013 752 45 (27) 770
Retained interests 20 4 - 24 64 8 - 72
Equity
Available-for-sale 197 58 (1) 254 203 51 (3) 251
Trading 22 - - 22 74 - - 74
42,857 5,319 (349) 47,827 41,136 3,233 (707) 43,662
Eliminations (4) - - (4) (4) - - (4)
Total $ 42,935 $ 5,323 $ (351) $ 47,907 $ 41,474 $ 3,256 $ (749) $ 43,981
(a) Substantially collateralized by U.S. mortgages. At December 31, 2014, $1,191 million related to securities issued by government-sponsored entities and $534 million
related to securities of private-label issuers. Securities issued by private-label issuers are collateralized primarily by pools of individual direct mortgage loans of financial
institutions.
The fair value of investment securities increased to $47,907 million at December 31, 2014, from $43,981 million at December
31, 2013, primarily due to purchases of U.S. government and federal agency securities at Synchrony Financial, and higher net
unrealized gains in U.S. corporate and State and municipal securities driven by lower interest rates in the U.S.