GE 2014 Annual Report Download - page 176
Download and view the complete annual report
Please find page 176 of the 2014 GE annual report below. You can navigate through the pages in the report by either clicking on the pages listed below, or by using the keyword search tool below to find specific information within the annual report.-
 1
1 -
2
-
3
-
4
-
5
-
6
-
7
-
8
-
9
-
10
-
11
-
12
-
13
-
14
-
15
-
16
-
17
-
18
-
19
-
20
-
21
-
22
-
23
-
24
-
25
-
26
-
27
-
28
-
29
-
30
-
31
-
32
-
33
-
34
-
35
-
36
-
37
-
38
-
39
-
40
-
41
-
42
-
43
-
44
-
45
-
46
-
47
-
48
-
49
-
50
-
51
-
52
-
53
-
54
-
55
-
56
-
57
-
58
-
59
-
60
-
61
-
62
-
63
-
64
-
65
-
66
-
67
-
68
-
69
-
70
-
71
-
72
-
73
-
74
-
75
-
76
-
77
-
78
-
79
-
80
-
81
-
82
-
83
-
84
-
85
-
86
-
87
-
88
-
89
-
90
-
91
-
92
-
93
-
94
-
95
-
96
-
97
-
98
-
99
-
100
-
101
-
102
-
103
-
104
-
105
-
106
-
107
-
108
-
109
-
110
-
111
-
112
-
113
-
114
-
115
-
116
-
117
-
118
-
119
-
120
-
121
-
122
-
123
-
124
-
125
-
126
-
127
-
128
-
129
-
130
-
131
-
132
-
133
-
134
-
135
-
136
-
137
-
138
-
139
-
140
-
141
-
142
-
143
-
144
-
145
-
146
-
147
-
148
-
149
-
150
-
151
-
152
-
153
-
154
-
155
-
156
-
157
-
158
-
159
-
160
-
161
-
162
-
163
-
164
-
165
-
 166
166 -
 167
167 -
 168
168 -
 169
169 -
 170
170 -
 171
171 -
 172
172 -
 173
173 -
 174
174 -
 175
175 -
 176
176 -
 177
177 -
 178
178 -
 179
179 -
 180
180 -
 181
181 -
 182
182 -
 183
183 -
 184
184 -
 185
185 -
 186
186 -
187
-
188
-
189
-
190
-
191
-
192
-
193
-
194
-
195
-
196
-
197
-
198
-
199
-
200
-
201
-
202
-
203
-
204
-
205
-
206
-
207
-
208
-
209
-
210
-
211
-
212
-
213
-
214
-
215
-
216
-
217
-
218
-
219
-
220
-
221
-
222
-
223
-
224
-
225
-
226
-
227
-
228
-
229
-
230
-
231
-
232
-
233
-
234
-
235
-
236
-
237
-
238
-
239
-
240
-
241
-
242
-
243
-
244
-
245
-
246
-
247
-
248
-
249
-
250
-
251
-
252
-
253
-
254
-
255
-
256
 |
 |

156 GE 2014 FORM 10-K
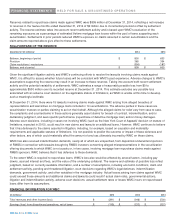
FINANCIAL STATEMENTS INVESTMENT SECURITIES
Our RMBS portfolio is collateralized primarily by pools of individual, direct mortgage loans, of which substantially all are in a
senior position in the capital structure of the deals, not other structured products such as collateralized debt obligations. Of the
total RMBS held at December 31, 2014, $1,191 million and $534 million related to agency and non-agency securities,
respectively. Additionally, $287 million was related to residential subprime credit securities, primarily supporting our
guaranteed investment contracts. Substantially all of the subprime exposure is related to securities backed by mortgage loans
originated in 2006 and prior. A majority of subprime RMBS have been downgraded to below investment grade and are insured
by Monoline insurers (Monolines). We continue to place partial reliance on Monolines with adequate capital and claims paying
resources depending on the extent of the Monoline’s anticipated ability to cover expected credit losses.
Our commercial mortgage-backed securities (CMBS) portfolio is collateralized by both diversified pools of mortgages that were
originated for securitization (conduit CMBS) and pools of large loans backed by high-quality properties (large loan CMBS), a
majority of which were originated in 2007 and prior. The vast majority of the securities in our CMBS portfolio have investment-
grade credit ratings.
Our asset-backed securities (ABS) portfolio is collateralized by senior secured loans of high-quality, middle-market companies
in a variety of industries, as well as a variety of diversified pools of assets such as student loans and credit cards. The vast
majority of the securities in our ABS portfolio are in a senior position in the capital structure of the deals.
PRE-TAX, OTHER-THAN-TEMPORARY IMPAIRMENTS ON INVESTMENT SECURITIES
(In millions) 2014 2013 2012
Total pre-tax, OTTI recognized $ 407 $ 798 $ 193
Pre-tax, OTTI recognized in AOCI (16) (31) (52)
Pre-tax, OTTI recognized in earnings(a) $ 391 $ 767 $ 141
(a) Included pre-tax, other-than-temporary impairments recorded in earnings related to equity securities of $221 million, $15 million and $39 million in 2014, 2013, and 2012,
respectively.
CHANGES IN CUMULATIVE CREDIT LOSS IMPAIRMENTS RECOGNIZED ON DEBT SECURITIES STILL HELD
(In millions) 2014 2013 2012
Cumulative credit loss impairments recognized, beginning of period $ 1,193 $ 588 $ 747
Credit loss impairments recognized on securities not previously impaired 4 389 27
Incremental credit loss impairments recognized
on securities previously impaired 77 336 40
Less credit loss impairments previously recognized on securities sold
during the period or that we intend to sell 304 120 226
Cumulative credit loss impairments recognized, end of period $ 970 $ 1,193 $ 588