GE 2014 Annual Report Download - page 175
Download and view the complete annual report
Please find page 175 of the 2014 GE annual report below. You can navigate through the pages in the report by either clicking on the pages listed below, or by using the keyword search tool below to find specific information within the annual report.-
 1
1 -
2
-
3
-
4
-
5
-
6
-
7
-
8
-
9
-
10
-
11
-
12
-
13
-
14
-
15
-
16
-
17
-
18
-
19
-
20
-
21
-
22
-
23
-
24
-
25
-
26
-
27
-
28
-
29
-
30
-
31
-
32
-
33
-
34
-
35
-
36
-
37
-
38
-
39
-
40
-
41
-
42
-
43
-
44
-
45
-
46
-
47
-
48
-
49
-
50
-
51
-
52
-
53
-
54
-
55
-
56
-
57
-
58
-
59
-
60
-
61
-
62
-
63
-
64
-
65
-
66
-
67
-
68
-
69
-
70
-
71
-
72
-
73
-
74
-
75
-
76
-
77
-
78
-
79
-
80
-
81
-
82
-
83
-
84
-
85
-
86
-
87
-
88
-
89
-
90
-
91
-
92
-
93
-
94
-
95
-
96
-
97
-
98
-
99
-
100
-
101
-
102
-
103
-
104
-
105
-
106
-
107
-
108
-
109
-
110
-
111
-
112
-
113
-
114
-
115
-
116
-
117
-
118
-
119
-
120
-
121
-
122
-
123
-
124
-
125
-
126
-
127
-
128
-
129
-
130
-
131
-
132
-
133
-
134
-
135
-
136
-
137
-
138
-
139
-
140
-
141
-
142
-
143
-
144
-
145
-
146
-
147
-
148
-
149
-
150
-
151
-
152
-
153
-
154
-
155
-
156
-
157
-
158
-
159
-
160
-
161
-
162
-
163
-
164
-
 165
165 -
 166
166 -
 167
167 -
 168
168 -
 169
169 -
 170
170 -
 171
171 -
 172
172 -
 173
173 -
 174
174 -
 175
175 -
 176
176 -
 177
177 -
 178
178 -
 179
179 -
 180
180 -
 181
181 -
 182
182 -
 183
183 -
 184
184 -
 185
185 -
186
-
187
-
188
-
189
-
190
-
191
-
192
-
193
-
194
-
195
-
196
-
197
-
198
-
199
-
200
-
201
-
202
-
203
-
204
-
205
-
206
-
207
-
208
-
209
-
210
-
211
-
212
-
213
-
214
-
215
-
216
-
217
-
218
-
219
-
220
-
221
-
222
-
223
-
224
-
225
-
226
-
227
-
228
-
229
-
230
-
231
-
232
-
233
-
234
-
235
-
236
-
237
-
238
-
239
-
240
-
241
-
242
-
243
-
244
-
245
-
246
-
247
-
248
-
249
-
250
-
251
-
252
-
253
-
254
-
255
-
256
 |
 |

GE 2014 FORM 10-K 155
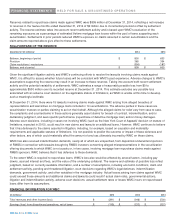
FINANCIAL STATEMENTS INVESTMENT SECURITIES
ESTIMATED FAIR VALUE AND GROSS UNREALIZED LOSSES OF AVAILABLE-FOR-SALE INVESTMENT
SECURITIES
In loss position for
Less than 12 months 12 months or more
Gross Gross
Estimated unrealized Estimated unrealized
December 31 (In millions) fair value(a) losses(a)(b) fair value losses(b)
2014
Debt
U.S. corporate
$
554
$
(16)
$
836
$
(53)
State and municipal 81 (1) 348 (55)
Residential mortgage-backed 30 - 159 (6)
Commercial mortgage-backed 165 (1) 204 (9)
Asset-backed 7,493 (158) 77 (17)
Corporate – non-U.S. 42 (1) 237 (29)
Government – non-U.S. 677 (2) 14 -
U.S. government and federal agency 705 - 1 -
Equity 18 (3) - -
Total
$
9,765
$
(182)
$
1,876
$
(169) (c)
2013
Debt
U.S. corporate
$
2,170
$
(122)
$
598
$
(95)
State and municipal 1,076 (82) 367 (109)
Residential mortgage-backed 232 (11) 430 (37)
Commercial mortgage-backed 396 (24) 780 (58)
Asset-backed 112 (2) 359 (44)
Corporate – non-U.S. 108 (4) 454 (83)
Government – non-U.S. 1,479 (6) 42 (1)
U.S. government and federal agency 229 (27) 254 -
Retained interests 2 - - -
Equity 253 (44) - -
Total
$
6,057
$
(322)
$
3,284
$
(427)
(a) Includes the estimated fair value of and gross unrealized losses on Corporate-non-U.S. and Equity securities held by GE. At December 31, 2014, there were no
Corporate-non-U.S. securities held by GE in a loss position. At December 31, 2014, the estimated fair value of and gross unrealized losses on Equity securities were $4
million and $(2) million, respectively. At December 31, 2013, the estimated fair value of and gross unrealized losses on Corporate-non-U.S. securities were $12 million
and $(1) million, respectively. At December 31, 2013 the estimated fair value of and gross unrealized losses on Equity securities were $222 million and $(41) million,
respectively.
(b) Included gross unrealized losses related to securities that had other-than-temporary impairments previously recognized of $29 million at December 31, 2014.
(c) The majority relate to debt securities held to support obligations to holders of GICs and more than 70% are debt securities that were considered to be investment-grade
by the major rating agencies at December 31, 2014.
We regularly review investment securities for other-than-temporary impairment (OTTI) using both qualitative and quantitative
criteria. For debt securities, our qualitative review considers our ability and intent to hold the security and the financial
condition of and near-term prospects for the issuer, including whether the issuer is in compliance with the terms and covenants
of the security. Our quantitative review considers whether there has been an adverse change in expected future cash flows.
Unrealized losses are not indicative of the amount of credit loss that would be recognized and at December 31, 2014 are
primarily due to increases in market yields subsequent to our purchase of the securities. We presently do not intend to sell the
vast majority of our debt securities that are in an unrealized loss position and believe that it is not more likely than not that we
will be required to sell the vast majority of these securities before anticipated recovery of our amortized cost. The
methodologies and significant inputs used to measure the amount of credit loss for our investment securities during 2014 have
not changed. For equity securities, we consider the duration and the severity of the unrealized loss. We believe that the
unrealized loss associated with our equity securities will be recovered within the foreseeable future.
Our corporate debt portfolio comprises securities issued by public and private corporations in various industries, primarily in
the U.S. Substantially all of our corporate debt securities are rated investment grade by the major rating agencies.