GE 2014 Annual Report Download - page 187
Download and view the complete annual report
Please find page 187 of the 2014 GE annual report below. You can navigate through the pages in the report by either clicking on the pages listed below, or by using the keyword search tool below to find specific information within the annual report.-
 1
1 -
2
-
3
-
4
-
5
-
6
-
7
-
8
-
9
-
10
-
11
-
12
-
13
-
14
-
15
-
16
-
17
-
18
-
19
-
20
-
21
-
22
-
23
-
24
-
25
-
26
-
27
-
28
-
29
-
30
-
31
-
32
-
33
-
34
-
35
-
36
-
37
-
38
-
39
-
40
-
41
-
42
-
43
-
44
-
45
-
46
-
47
-
48
-
49
-
50
-
51
-
52
-
53
-
54
-
55
-
56
-
57
-
58
-
59
-
60
-
61
-
62
-
63
-
64
-
65
-
66
-
67
-
68
-
69
-
70
-
71
-
72
-
73
-
74
-
75
-
76
-
77
-
78
-
79
-
80
-
81
-
82
-
83
-
84
-
85
-
86
-
87
-
88
-
89
-
90
-
91
-
92
-
93
-
94
-
95
-
96
-
97
-
98
-
99
-
100
-
101
-
102
-
103
-
104
-
105
-
106
-
107
-
108
-
109
-
110
-
111
-
112
-
113
-
114
-
115
-
116
-
117
-
118
-
119
-
120
-
121
-
122
-
123
-
124
-
125
-
126
-
127
-
128
-
129
-
130
-
131
-
132
-
133
-
134
-
135
-
136
-
137
-
138
-
139
-
140
-
141
-
142
-
143
-
144
-
145
-
146
-
147
-
148
-
149
-
150
-
151
-
152
-
153
-
154
-
155
-
156
-
157
-
158
-
159
-
160
-
161
-
162
-
163
-
164
-
165
-
166
-
167
-
168
-
169
-
170
-
171
-
172
-
173
-
174
-
175
-
176
-
 177
177 -
 178
178 -
 179
179 -
 180
180 -
 181
181 -
 182
182 -
 183
183 -
 184
184 -
 185
185 -
 186
186 -
 187
187 -
 188
188 -
 189
189 -
 190
190 -
 191
191 -
 192
192 -
 193
193 -
 194
194 -
 195
195 -
 196
196 -
 197
197 -
198
-
199
-
200
-
201
-
202
-
203
-
204
-
205
-
206
-
207
-
208
-
209
-
210
-
211
-
212
-
213
-
214
-
215
-
216
-
217
-
218
-
219
-
220
-
221
-
222
-
223
-
224
-
225
-
226
-
227
-
228
-
229
-
230
-
231
-
232
-
233
-
234
-
235
-
236
-
237
-
238
-
239
-
240
-
241
-
242
-
243
-
244
-
245
-
246
-
247
-
248
-
249
-
250
-
251
-
252
-
253
-
254
-
255
-
256
 |
 |

GE 2014 FORM 10-K 167
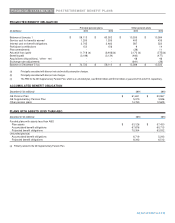
FINANCIAL STATEMENTS ACQUISITIONS & INTANGIBLE ASSETS
INTANGIBLE ASSETS SUBJECT TO AMORTIZATION
2014 2013
Gross Gross
carrying Accumulated carrying Accumulated
December 31 (In millions) amount amortization Net amount amortization Net
Customer-related $ 8,484 $ (2,617) $ 5,867 $ 7,938 $ (2,312) $ 5,626
Patents and technology 6,772 (2,977) 3,795 6,602 (2,621) 3,981
Capitalized software 8,269 (4,973) 3,296 8,256 (5,252) 3,004
Trademarks 1,159 (271) 888 1,356 (295) 1,061
Lease valuations 485 (377) 108 703 (498) 205
Present value of future profits(a) 614 (614) - 574 (574) -
All other 503 (431) 72 632 (359) 273
Total $ 26,286 $ (12,260) $ 14,026 $ 26,061 $ (11,911) $ 14,150
(a) Balances at December 31, 2014 and 2013 reflect adjustments of $293 million and $322 million, respectively, to the present value of future profits in our run-off insurance
operation to reflect the effects that would have been recognized had the related unrealized investment securities holding gains and losses actually been realized.
During 2014, we recorded additions to intangible assets subject to amortization of $2,090 million. The components of finite-
lived intangible assets acquired during 2014 and their respective weighted average amortizable period follow.
COMPONENTS OF FINITE-LIVED INTANGIBLE ASSETS ACQUIRED DURING 2014
Weighted-average
Gross amortizable period
(In millions) carrying value (in years)
Customer-related $ 731 14.1
Patents and technology 178 10.8
Capitalized software 1,123 5.7
Trademarks 52 17.2
Lease valuations 1 7.0
All other 6 2.5
Consolidated amortization expense related to intangible assets subject to amortization was $1,789 million, $1,711 million and
$1,612 million in 2014, 2013 and 2012, respectively. Estimated annual pre-tax amortization for intangible assets over the next
five calendar years follows.
ESTIMATED 5 YEAR CONSOLIDATED AMORTIZATION
(In millions) 2015 2016 2017 2018 2019
Estimated annual pre-tax amortization $ 1,725 $ 1,566 $ 1,414 $ 1,249 $ 1,077