GE 2014 Annual Report Download - page 244
Download and view the complete annual report
Please find page 244 of the 2014 GE annual report below. You can navigate through the pages in the report by either clicking on the pages listed below, or by using the keyword search tool below to find specific information within the annual report.-
 1
1 -
2
-
3
-
4
-
5
-
6
-
7
-
8
-
9
-
10
-
11
-
12
-
13
-
14
-
15
-
16
-
17
-
18
-
19
-
20
-
21
-
22
-
23
-
24
-
25
-
26
-
27
-
28
-
29
-
30
-
31
-
32
-
33
-
34
-
35
-
36
-
37
-
38
-
39
-
40
-
41
-
42
-
43
-
44
-
45
-
46
-
47
-
48
-
49
-
50
-
51
-
52
-
53
-
54
-
55
-
56
-
57
-
58
-
59
-
60
-
61
-
62
-
63
-
64
-
65
-
66
-
67
-
68
-
69
-
70
-
71
-
72
-
73
-
74
-
75
-
76
-
77
-
78
-
79
-
80
-
81
-
82
-
83
-
84
-
85
-
86
-
87
-
88
-
89
-
90
-
91
-
92
-
93
-
94
-
95
-
96
-
97
-
98
-
99
-
100
-
101
-
102
-
103
-
104
-
105
-
106
-
107
-
108
-
109
-
110
-
111
-
112
-
113
-
114
-
115
-
116
-
117
-
118
-
119
-
120
-
121
-
122
-
123
-
124
-
125
-
126
-
127
-
128
-
129
-
130
-
131
-
132
-
133
-
134
-
135
-
136
-
137
-
138
-
139
-
140
-
141
-
142
-
143
-
144
-
145
-
146
-
147
-
148
-
149
-
150
-
151
-
152
-
153
-
154
-
155
-
156
-
157
-
158
-
159
-
160
-
161
-
162
-
163
-
164
-
165
-
166
-
167
-
168
-
169
-
170
-
171
-
172
-
173
-
174
-
175
-
176
-
177
-
178
-
179
-
180
-
181
-
182
-
183
-
184
-
185
-
186
-
187
-
188
-
189
-
190
-
191
-
192
-
193
-
194
-
195
-
196
-
197
-
198
-
199
-
200
-
201
-
202
-
203
-
204
-
205
-
206
-
207
-
208
-
209
-
210
-
211
-
212
-
213
-
214
-
215
-
216
-
217
-
218
-
219
-
220
-
221
-
222
-
223
-
224
-
225
-
226
-
227
-
228
-
229
-
230
-
231
-
232
-
233
-
 234
234 -
 235
235 -
 236
236 -
 237
237 -
 238
238 -
 239
239 -
 240
240 -
 241
241 -
 242
242 -
 243
243 -
 244
244 -
 245
245 -
 246
246 -
 247
247 -
 248
248 -
 249
249 -
 250
250 -
 251
251 -
 252
252 -
 253
253 -
 254
254 -
255
-
256
 |
 |

224 GE 2014 FORM 10-K
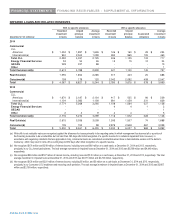
FINANCIAL STATEMENTS QUARTERLY INFORMATION
Interest and other financial charges Provision (benefit) for income taxes
(In millions) 2014 2013
2012 2014 2013 2012
GE Capital $ 8,397 $ 9,267 $ 11,596 $ 138 $ (992) $ 521
Corporate items and eliminations(a) 1,085 849 811 1,634 1,668 2,013
Total $ 9,482 $ 10,116 $ 12,407 $ 1,772 $ 676 $ 2,534
(a) Included amounts for Power & Water, Oil & Gas, Energy Management, Aviation, Healthcare, Transportation and Appliances & Lighting, for which our measure of
segment profit excludes interest and other financial charges and income taxes.
Property, plant and equipment – net associated with operations based in the United States were $28,186 million, $28,657
million and $27,192 million at year-end 2014, 2013 and 2012, respectively. Property, plant and equipment – net associated
with operations based outside the United States were $38,201 million, $40,170 million and $41,441 million at year-end 2014,
2013 and 2012, respectively.
NOTE 29. QUARTERLY INFORMATION (UNAUDITED)
First quarter Second quarter Third quarter Fourth quarter
(In millions; per-share amounts in dollars) 2014 2013 2014 2013 2014 2013 2014 2013
Consolidated operations
Earnings from continuing operations $ 2,940 $ 3,631 $ 3,586 $ 3,423 $ 3,452 $ 3,272 $ 5,479 $ 5,149
Earnings (loss) from discontinued
operations 12 (120) (41) (124) 57 (91) (140) (1,785)
Net earnings 2,952 3,511 3,545 3,299 3,509 3,181 5,339 3,364
Less net earnings (loss) attributable to
noncontrolling interests (47) (16) - 166 (28) (10) 187 158
Net earnings attributable to
the Company $ 2,999 $ 3,527 $ 3,545 $ 3,133 $ 3,537 $ 3,191 $ 5,152 $ 3,206
Per-share amounts – earnin
g
s from
continuing operations
Diluted earnings per share $ 0.29 $ 0.35 $ 0.35 $ 0.31 $ 0.34 $ 0.32 $ 0.52 $ 0.49
Basic earnings per share 0.30 0.35 0.36 0.32 0.35 0.32 0.53 0.49
Per-share amounts – earnings (loss)
from discontinued operations
Diluted earnings per share - (0.01) - (0.01) 0.01 (0.01) (0.01) (0.18)
Basic earnings per share - (0.01) - (0.01) 0.01 (0.01) (0.01) (0.18)
Per-share amounts – net earnings
Diluted earnings per share 0.30 0.34 0.35 0.30 0.35 0.31 0.51 0.32
Basic earnings per share 0.30 0.34 0.35 0.30 0.35 0.31 0.51 0.32
Selected data
GE
Sales of goods and services $ 24,011 $ 22,303 $ 26,226 $ 24,623 $ 26,025 $ 25,262 $ 31,046 $ 28,826
Gross profit from sales 5,326 4,867 6,090 6,006 6,148 5,691 7,867 6,820
GECC
Total revenues 10,515 11,468 10,247 10,916 10,451 10,606 11,512 11,077
Earnings from continuing operations
attributable to the Company 1,933 1,938 1,864 1,924 1,492 1,903 2,052 2,493
For GE, gross profit from sales is sales of goods and services less costs of goods and services sold.
Earnings-per-share amounts are computed independently each quarter for earnings from continuing operations, earnings
(loss) from discontinued operations and net earnings. As a result, the sum of each quarter’s per-share amount may not equal
the total per-share amount for the respective year; and the sum of per-share amounts from continuing operations and
discontinued operations may not equal the total per-share amounts for net earnings for the respective quarters.