GE 2014 Annual Report Download - page 177
Download and view the complete annual report
Please find page 177 of the 2014 GE annual report below. You can navigate through the pages in the report by either clicking on the pages listed below, or by using the keyword search tool below to find specific information within the annual report.-
 1
1 -
2
-
3
-
4
-
5
-
6
-
7
-
8
-
9
-
10
-
11
-
12
-
13
-
14
-
15
-
16
-
17
-
18
-
19
-
20
-
21
-
22
-
23
-
24
-
25
-
26
-
27
-
28
-
29
-
30
-
31
-
32
-
33
-
34
-
35
-
36
-
37
-
38
-
39
-
40
-
41
-
42
-
43
-
44
-
45
-
46
-
47
-
48
-
49
-
50
-
51
-
52
-
53
-
54
-
55
-
56
-
57
-
58
-
59
-
60
-
61
-
62
-
63
-
64
-
65
-
66
-
67
-
68
-
69
-
70
-
71
-
72
-
73
-
74
-
75
-
76
-
77
-
78
-
79
-
80
-
81
-
82
-
83
-
84
-
85
-
86
-
87
-
88
-
89
-
90
-
91
-
92
-
93
-
94
-
95
-
96
-
97
-
98
-
99
-
100
-
101
-
102
-
103
-
104
-
105
-
106
-
107
-
108
-
109
-
110
-
111
-
112
-
113
-
114
-
115
-
116
-
117
-
118
-
119
-
120
-
121
-
122
-
123
-
124
-
125
-
126
-
127
-
128
-
129
-
130
-
131
-
132
-
133
-
134
-
135
-
136
-
137
-
138
-
139
-
140
-
141
-
142
-
143
-
144
-
145
-
146
-
147
-
148
-
149
-
150
-
151
-
152
-
153
-
154
-
155
-
156
-
157
-
158
-
159
-
160
-
161
-
162
-
163
-
164
-
165
-
166
-
 167
167 -
 168
168 -
 169
169 -
 170
170 -
 171
171 -
 172
172 -
 173
173 -
 174
174 -
 175
175 -
 176
176 -
 177
177 -
 178
178 -
 179
179 -
 180
180 -
 181
181 -
 182
182 -
 183
183 -
 184
184 -
 185
185 -
 186
186 -
 187
187 -
188
-
189
-
190
-
191
-
192
-
193
-
194
-
195
-
196
-
197
-
198
-
199
-
200
-
201
-
202
-
203
-
204
-
205
-
206
-
207
-
208
-
209
-
210
-
211
-
212
-
213
-
214
-
215
-
216
-
217
-
218
-
219
-
220
-
221
-
222
-
223
-
224
-
225
-
226
-
227
-
228
-
229
-
230
-
231
-
232
-
233
-
234
-
235
-
236
-
237
-
238
-
239
-
240
-
241
-
242
-
243
-
244
-
245
-
246
-
247
-
248
-
249
-
250
-
251
-
252
-
253
-
254
-
255
-
256
 |
 |

GE 2014 FORM 10-K 157
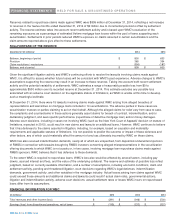
FINANCIAL STATEMENTS INVESTMENT SECURITIES
CONTRACTUAL MATURITIES OF INVESTMENT IN AVAILABLE-FOR-SALE DEBT SECURITIES
(EXCLUDING MORTGAGE-BACKED AND ASSET-BACKED SECURITIES)
Amortized
Estimated
(In millions) cost fair value
Due
Within one year $ 2,478 $ 2,492
After one year through five years 3,521 3,768
After five years through ten years 5,285 5,686
After ten years 18,782 22,888
We expect actual maturities to differ from contractual maturities because borrowers have the right to call or prepay certain
obligations.
GROSS REALIZED GAINS AND LOSSES ON AVAILABLE-FOR-SALE INVESTMENT SECURITIES
(In millions) 2014 2013 2012
GE
Gains $ 3 $ 1 $ -
Losses, including impairments (218) (20) (1)
Net (215) (19) (1)
GECC
Gains 169 239 177
Losses, including impairments (186) (762) (211)
Net (17) (523) (34)
Total $ (232) $ (542) $ (35)
Although we generally do not have the intent to sell any specific securities at the end of the period, in the ordinary course of
managing our investment securities portfolio, we may sell securities prior to their maturities for a variety of reasons, including
diversification, credit quality, yield and liquidity requirements and the funding of claims and obligations to policyholders. In
some of our bank subsidiaries, we maintain a certain level of purchases and sales volume principally of non-U.S. government
debt securities. In these situations, fair value approximates carrying value for these securities.
Proceeds from investment securities sales and early redemptions by issuers totaled $6,549 million, $19,276 million and
$12,745 million in 2014, 2013 and 2012 respectively, principally from sales of short-term government securities in our bank
subsidiaries and redemptions of non-U.S. corporate and asset-backed securities in our CLL business. The 2013 amount also
included proceeds from the sale of Comcast guaranteed debt and short-term securities in our Treasury operations.
We recognized pre-tax gains (losses) on trading securities of $10 million, $48 million and $20 million in 2014, 2013 and 2012,
respectively.