GE 2014 Annual Report Download - page 63
Download and view the complete annual report
Please find page 63 of the 2014 GE annual report below. You can navigate through the pages in the report by either clicking on the pages listed below, or by using the keyword search tool below to find specific information within the annual report.-
 1
1 -
2
-
3
-
4
-
5
-
6
-
7
-
8
-
9
-
10
-
11
-
12
-
13
-
14
-
15
-
16
-
17
-
18
-
19
-
20
-
21
-
22
-
23
-
24
-
25
-
26
-
27
-
28
-
29
-
30
-
31
-
32
-
33
-
34
-
35
-
36
-
37
-
38
-
39
-
40
-
41
-
42
-
43
-
44
-
45
-
46
-
47
-
48
-
49
-
50
-
51
-
52
-
 53
53 -
 54
54 -
 55
55 -
 56
56 -
 57
57 -
 58
58 -
 59
59 -
 60
60 -
 61
61 -
 62
62 -
 63
63 -
 64
64 -
 65
65 -
 66
66 -
 67
67 -
 68
68 -
 69
69 -
 70
70 -
 71
71 -
 72
72 -
 73
73 -
74
-
75
-
76
-
77
-
78
-
79
-
80
-
81
-
82
-
83
-
84
-
85
-
86
-
87
-
88
-
89
-
90
-
91
-
92
-
93
-
94
-
95
-
96
-
97
-
98
-
99
-
100
-
101
-
102
-
103
-
104
-
105
-
106
-
107
-
108
-
109
-
110
-
111
-
112
-
113
-
114
-
115
-
116
-
117
-
118
-
119
-
120
-
121
-
122
-
123
-
124
-
125
-
126
-
127
-
128
-
129
-
130
-
131
-
132
-
133
-
134
-
135
-
136
-
137
-
138
-
139
-
140
-
141
-
142
-
143
-
144
-
145
-
146
-
147
-
148
-
149
-
150
-
151
-
152
-
153
-
154
-
155
-
156
-
157
-
158
-
159
-
160
-
161
-
162
-
163
-
164
-
165
-
166
-
167
-
168
-
169
-
170
-
171
-
172
-
173
-
174
-
175
-
176
-
177
-
178
-
179
-
180
-
181
-
182
-
183
-
184
-
185
-
186
-
187
-
188
-
189
-
190
-
191
-
192
-
193
-
194
-
195
-
196
-
197
-
198
-
199
-
200
-
201
-
202
-
203
-
204
-
205
-
206
-
207
-
208
-
209
-
210
-
211
-
212
-
213
-
214
-
215
-
216
-
217
-
218
-
219
-
220
-
221
-
222
-
223
-
224
-
225
-
226
-
227
-
228
-
229
-
230
-
231
-
232
-
233
-
234
-
235
-
236
-
237
-
238
-
239
-
240
-
241
-
242
-
243
-
244
-
245
-
246
-
247
-
248
-
249
-
250
-
251
-
252
-
253
-
254
-
255
-
256
 |
 |

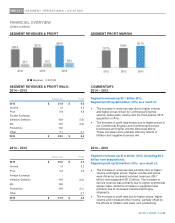
GE 2014 FORM 10-K 43
MD&A SEGMENT OPERATIONS | AVIATION
FINANCIAL OVERVIEW
(Dollars in billions)
SEGMENT REVENUES & PROFIT SEGMENT PROFIT MARGIN
SEGMENT REVENUES & PROFIT WALK: COMMENTARY:
2014 – 2013 2014 – 2013
Segment revenues up $2.1 billion (9%);
Segment profit up $0.6 billion (14%) as a result of:
x The increase in revenues was due to higher volume
and higher prices driven by Commercial Engines
volume, spare parts volume and the third-quarter 2013
acquisition of Avio.
x The increase in profit was mainly due to higher prices in
our Commercial Engines and Commercial Services
businesses and higher volume discussed above.
These increases were partially offset by effects of
inflation and negative business mix.
Revenues Profit
2013 $ 21.9 $ 4.3
Volume 1.2 0.2
Price 0.8 0.8
Foreign Exchange - -
(Inflation)/Deflation N/A (0.3)
Mix N/A (0.2)
Productivity N/A -
Other 0.1 0.1
2014 $ 24.0 $ 5.0
2013 – 2012 2013 – 2012
Segment revenues up $1.9 billion (10%) (including $0.5
billion from acquisitions);
Segment profit up $0.6 billion (16%) as a result of:
x The increase in revenues was primarily due to higher
volume and higher prices. Higher volume and prices
were driven by increased services revenues ($0.7
billion) and equipment ($1.2 billion). The increase in
service revenue was primarily due to higher commercial
spares sales, while the increase in equipment was
primarily due to increased Commercial Engine
shipments.
x The increase in profit was due to higher prices, higher
volume and increased other income, partially offset by
the effects of inflation and lower cost productivity.
Revenues Profit
2012 $ 20.0 $ 3.7
Volume 1.4 0.2
Price 0.6 0.6
Foreign Exchange - -
(Inflation)/Deflation N/A (0.2)
Mix N/A -
Productivity N/A (0.1)
Other - 0.1
2013 $ 21.9 $ 4.3
Revenue Profit