GE 2014 Annual Report Download - page 195
Download and view the complete annual report
Please find page 195 of the 2014 GE annual report below. You can navigate through the pages in the report by either clicking on the pages listed below, or by using the keyword search tool below to find specific information within the annual report.-
 1
1 -
2
-
3
-
4
-
5
-
6
-
7
-
8
-
9
-
10
-
11
-
12
-
13
-
14
-
15
-
16
-
17
-
18
-
19
-
20
-
21
-
22
-
23
-
24
-
25
-
26
-
27
-
28
-
29
-
30
-
31
-
32
-
33
-
34
-
35
-
36
-
37
-
38
-
39
-
40
-
41
-
42
-
43
-
44
-
45
-
46
-
47
-
48
-
49
-
50
-
51
-
52
-
53
-
54
-
55
-
56
-
57
-
58
-
59
-
60
-
61
-
62
-
63
-
64
-
65
-
66
-
67
-
68
-
69
-
70
-
71
-
72
-
73
-
74
-
75
-
76
-
77
-
78
-
79
-
80
-
81
-
82
-
83
-
84
-
85
-
86
-
87
-
88
-
89
-
90
-
91
-
92
-
93
-
94
-
95
-
96
-
97
-
98
-
99
-
100
-
101
-
102
-
103
-
104
-
105
-
106
-
107
-
108
-
109
-
110
-
111
-
112
-
113
-
114
-
115
-
116
-
117
-
118
-
119
-
120
-
121
-
122
-
123
-
124
-
125
-
126
-
127
-
128
-
129
-
130
-
131
-
132
-
133
-
134
-
135
-
136
-
137
-
138
-
139
-
140
-
141
-
142
-
143
-
144
-
145
-
146
-
147
-
148
-
149
-
150
-
151
-
152
-
153
-
154
-
155
-
156
-
157
-
158
-
159
-
160
-
161
-
162
-
163
-
164
-
165
-
166
-
167
-
168
-
169
-
170
-
171
-
172
-
173
-
174
-
175
-
176
-
177
-
178
-
179
-
180
-
181
-
182
-
183
-
184
-
 185
185 -
 186
186 -
 187
187 -
 188
188 -
 189
189 -
 190
190 -
 191
191 -
 192
192 -
 193
193 -
 194
194 -
 195
195 -
 196
196 -
 197
197 -
 198
198 -
 199
199 -
 200
200 -
 201
201 -
 202
202 -
 203
203 -
 204
204 -
 205
205 -
206
-
207
-
208
-
209
-
210
-
211
-
212
-
213
-
214
-
215
-
216
-
217
-
218
-
219
-
220
-
221
-
222
-
223
-
224
-
225
-
226
-
227
-
228
-
229
-
230
-
231
-
232
-
233
-
234
-
235
-
236
-
237
-
238
-
239
-
240
-
241
-
242
-
243
-
244
-
245
-
246
-
247
-
248
-
249
-
250
-
251
-
252
-
253
-
254
-
255
-
256
 |
 |

GE 2014 FORM 10-K 175
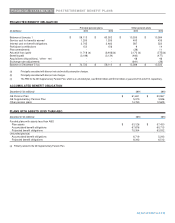
FINANCIAL STATEMENTS POSTRETIREMENT BENEFIT PLANS
According to statute, the aggregate holdings of all qualifying employer securities (e.g., GE common stock) and qualifying
employer real property may not exceed 10% of the fair value of trust assets at the time of purchase. GE securities represented
3.8% and 4.5% of trust assets at year-end 2014 and 2013, respectively.
The GE Pension Plan has a broadly diversified portfolio of investments in equities, fixed income, private equities, real estate
and hedge funds; these investments are both U.S. and non-U.S. in nature. As of December 31, 2014, U.S. government direct
and indirect obligations represented 16% of total GE Pension Plan assets. No other sector concentration of assets exceeded
15% of total GE Pension Plan assets.
The following tables present GE Pension Plan investments measured at fair value.
(In millions) Level 1 Level 2 Level 3 Total
December 31, 2014
Equity securities
U.S. equity securities(a) $ 11,493 $ 1,463 $ - $ 12,956
Non-U.S. equity securities(a) 7,021 2,132 - 9,153
Debt securities
Fixed income and cash investment funds 245 4,255 - 4,500
U.S. corporate(b) - 5,153 2 5,155
Residential mortgage-backed - 1,118 1 1,119
Non-U.S. Corporate - 1,097 3 1,100
U.S. government and federal agency - 2,468 - 2,468
Other debt securities(c) - 1,042 - 1,042
Private equities(a) - 32 5,217 5,249
Real estate(a) - - 3,129 3,129
Other investments(d) - 70 2,248 2,318
Total investments $ 18,759 $ 18,830 $ 10,600 $ 48,189
Other
(
e
)
91
Total assets $ 48,280
December 31, 2013
Equity securities
U.S. equity securities(a) $ 11,067 $ 1,568 $ - $ 12,635
Non-U.S. equity securities(a) 7,832 1,292 - 9,124
Debt securities
Fixed income and cash investment funds - 2,078 - 2,078
U.S. corporate(b) - 4,555 - 4,555
Residential mortgage-backed - 1,093 - 1,093
Non-U.S. Corporate - 1,269 - 1,269
U.S. government and federal agency - 5,253 - 5,253
Other debt securities(c) - 1,048 - 1,048
Private equities(a) - - 6,269 6,269
Real estate(a) - - 3,354 3,354
Other investments(d) - 169 1,622 1,791
Total investments $ 18,899 $ 18,325 $ 11,245 $ 48,469
Other
(
e
)
(
172
)
Total assets $ 48,297
(a) Included direct investments and investment funds.
(b) Primarily represented investment-grade bonds of U.S. issuers from diverse industries.
(c) Primarily represented investments in state and municipal debt, non-U.S. government bonds and commercial mortgage-backed securities.
(d) Substantially all represented hedge fund investments.
(e) Primarily represented net unsettled transactions related investment activity and cash balances.