GE 2014 Annual Report Download - page 201
Download and view the complete annual report
Please find page 201 of the 2014 GE annual report below. You can navigate through the pages in the report by either clicking on the pages listed below, or by using the keyword search tool below to find specific information within the annual report.-
 1
1 -
2
-
3
-
4
-
5
-
6
-
7
-
8
-
9
-
10
-
11
-
12
-
13
-
14
-
15
-
16
-
17
-
18
-
19
-
20
-
21
-
22
-
23
-
24
-
25
-
26
-
27
-
28
-
29
-
30
-
31
-
32
-
33
-
34
-
35
-
36
-
37
-
38
-
39
-
40
-
41
-
42
-
43
-
44
-
45
-
46
-
47
-
48
-
49
-
50
-
51
-
52
-
53
-
54
-
55
-
56
-
57
-
58
-
59
-
60
-
61
-
62
-
63
-
64
-
65
-
66
-
67
-
68
-
69
-
70
-
71
-
72
-
73
-
74
-
75
-
76
-
77
-
78
-
79
-
80
-
81
-
82
-
83
-
84
-
85
-
86
-
87
-
88
-
89
-
90
-
91
-
92
-
93
-
94
-
95
-
96
-
97
-
98
-
99
-
100
-
101
-
102
-
103
-
104
-
105
-
106
-
107
-
108
-
109
-
110
-
111
-
112
-
113
-
114
-
115
-
116
-
117
-
118
-
119
-
120
-
121
-
122
-
123
-
124
-
125
-
126
-
127
-
128
-
129
-
130
-
131
-
132
-
133
-
134
-
135
-
136
-
137
-
138
-
139
-
140
-
141
-
142
-
143
-
144
-
145
-
146
-
147
-
148
-
149
-
150
-
151
-
152
-
153
-
154
-
155
-
156
-
157
-
158
-
159
-
160
-
161
-
162
-
163
-
164
-
165
-
166
-
167
-
168
-
169
-
170
-
171
-
172
-
173
-
174
-
175
-
176
-
177
-
178
-
179
-
180
-
181
-
182
-
183
-
184
-
185
-
186
-
187
-
188
-
189
-
190
-
 191
191 -
 192
192 -
 193
193 -
 194
194 -
 195
195 -
 196
196 -
 197
197 -
 198
198 -
 199
199 -
 200
200 -
 201
201 -
 202
202 -
 203
203 -
 204
204 -
 205
205 -
 206
206 -
 207
207 -
 208
208 -
 209
209 -
 210
210 -
 211
211 -
212
-
213
-
214
-
215
-
216
-
217
-
218
-
219
-
220
-
221
-
222
-
223
-
224
-
225
-
226
-
227
-
228
-
229
-
230
-
231
-
232
-
233
-
234
-
235
-
236
-
237
-
238
-
239
-
240
-
241
-
242
-
243
-
244
-
245
-
246
-
247
-
248
-
249
-
250
-
251
-
252
-
253
-
254
-
255
-
256
 |
 |

GE 2014 FORM 10-K 181
FINANCIAL STATEMENTS ALL OTHER LIABILITIES
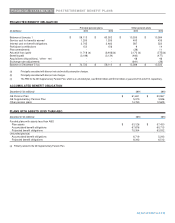
POSTRETIREMENT BENEFIT PLANS
2014 COST OF POSTRETIREMENT BENEFIT PLANS AND CHANGES IN OTHER COMPREHENSIVE INCOME
Total Principal Othe
r
Retiree
postretirement pension pension benefit
(In millions) benefit plans plans plans plans
Cost of postretirement benefit plans $ 4,805 $ 3,604 $ 412 $ 789
Changes in other comprehensive income
Prior service cost – current year (615) - (29) (586)
Net actuarial loss – current year(a) 14,843 12,115 1,282 1,446
Net curtailment/settlement (113) (65) - (48)
Prior service cost amortization (573) (214) (6) (353)
Net actuarial gain (loss) amortization (2,620) (2,565) (205) 150
Total changes in other comprehensive income 10,922 9,271 1,042 609
Cost of postretirement benefit plans and
changes in other comprehensive income $ 15,727
$ 12,875
$ 1,454
$ 1,398
(a) Principally associated with discount rate and mortality assumption changes.
NOTE 13. ALL OTHER LIABILITIES
This caption includes liabilities for various items including non-current compensation and benefits, deferred income, interest on
tax liabilities, unrecognized tax benefits, environmental remediation, asset retirement obligations, derivative instruments,
product warranties and a variety of sundry items.
Accruals for non-current compensation and benefits amounted to $42,354 million and $27,853 million at December 31, 2014
and 2013, respectively. These amounts include compensation and benefit liabilities, such as postretirement benefits and
deferred incentive compensation. See Note 12.
We are involved in numerous remediation actions to clean up hazardous wastes as required by federal and state laws.
Liabilities for remediation costs exclude possible insurance recoveries and, when dates and amounts of such costs are not
known, are not discounted. When there appears to be a range of possible costs with equal likelihood, liabilities are based on
the low end of such range. It is reasonably possible that our environmental remediation exposure will exceed amounts
accrued. However, due to uncertainties about the status of laws, regulations, technology and information related to individual
sites, such amounts are not reasonably estimable. Total reserves related to environmental remediation and asbestos claims,
were $2,182 million at December 31, 2014.