GE 2014 Annual Report Download - page 243
Download and view the complete annual report
Please find page 243 of the 2014 GE annual report below. You can navigate through the pages in the report by either clicking on the pages listed below, or by using the keyword search tool below to find specific information within the annual report.-
 1
1 -
2
-
3
-
4
-
5
-
6
-
7
-
8
-
9
-
10
-
11
-
12
-
13
-
14
-
15
-
16
-
17
-
18
-
19
-
20
-
21
-
22
-
23
-
24
-
25
-
26
-
27
-
28
-
29
-
30
-
31
-
32
-
33
-
34
-
35
-
36
-
37
-
38
-
39
-
40
-
41
-
42
-
43
-
44
-
45
-
46
-
47
-
48
-
49
-
50
-
51
-
52
-
53
-
54
-
55
-
56
-
57
-
58
-
59
-
60
-
61
-
62
-
63
-
64
-
65
-
66
-
67
-
68
-
69
-
70
-
71
-
72
-
73
-
74
-
75
-
76
-
77
-
78
-
79
-
80
-
81
-
82
-
83
-
84
-
85
-
86
-
87
-
88
-
89
-
90
-
91
-
92
-
93
-
94
-
95
-
96
-
97
-
98
-
99
-
100
-
101
-
102
-
103
-
104
-
105
-
106
-
107
-
108
-
109
-
110
-
111
-
112
-
113
-
114
-
115
-
116
-
117
-
118
-
119
-
120
-
121
-
122
-
123
-
124
-
125
-
126
-
127
-
128
-
129
-
130
-
131
-
132
-
133
-
134
-
135
-
136
-
137
-
138
-
139
-
140
-
141
-
142
-
143
-
144
-
145
-
146
-
147
-
148
-
149
-
150
-
151
-
152
-
153
-
154
-
155
-
156
-
157
-
158
-
159
-
160
-
161
-
162
-
163
-
164
-
165
-
166
-
167
-
168
-
169
-
170
-
171
-
172
-
173
-
174
-
175
-
176
-
177
-
178
-
179
-
180
-
181
-
182
-
183
-
184
-
185
-
186
-
187
-
188
-
189
-
190
-
191
-
192
-
193
-
194
-
195
-
196
-
197
-
198
-
199
-
200
-
201
-
202
-
203
-
204
-
205
-
206
-
207
-
208
-
209
-
210
-
211
-
212
-
213
-
214
-
215
-
216
-
217
-
218
-
219
-
220
-
221
-
222
-
223
-
224
-
225
-
226
-
227
-
228
-
229
-
230
-
231
-
232
-
 233
233 -
 234
234 -
 235
235 -
 236
236 -
 237
237 -
 238
238 -
 239
239 -
 240
240 -
 241
241 -
 242
242 -
 243
243 -
 244
244 -
 245
245 -
 246
246 -
 247
247 -
 248
248 -
 249
249 -
 250
250 -
 251
251 -
 252
252 -
 253
253 -
254
-
255
-
256
 |
 |

GE 2014 FORM 10-K 223
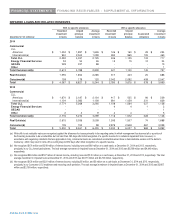
FINANCIAL STATEMENTS OPERATING SEGMENTS
REVENUES
Total revenues(a) Intersegment revenues(b) External revenues
(In millions) 2014 2013 2012 2014 2013 2012 2014 2013 2012
Power & Water $ 27,564 $ 24,724 $ 28,299 $ 969 $ 947 $ 1,119 $ 26,595 $ 23,777 $ 27,180
Oil & Gas 18,676 16,975 15,241 401 360 314 18,275 16,615 14,927
Energy Management 7,319 7,569 7,412 890 848 487 6,429 6,721 6,925
Aviation 23,990 21,911 19,994 692 500 672 23,298 21,411 19,322
Healthcare 18,299 18,200 18,290 6 14 37 18,293 18,186 18,253
Transportation 5,650 5,885 5,608 (2) 12 11 5,652 5,873 5,597
Appliances & Lighting 8,404 8,338 7,967 22 25 23 8,382 8,313 7,944
Total industrial 109,902 103,602 102,811 2,978 2,706 2,663 106,924 100,896 100,148
GE Ca
p
ital 42,725 44,067 45,364 1,348 1,150 1,037 41,377 42,917 44,327
Corporate items
and eliminations(c) (4,038) (1,624) (1,491) (4,326) (3,856) (3,700) 288 2,232 2,209
Total $ 148,589 $ 146,045 $ 146,684 $ - $ - $ - $ 148,589 $ 146,045 $ 146,684
(a) Revenues of GE businesses include income from sales of goods and services to customers and other income.
(b) Sales from one component to another generally are priced at equivalent commercial selling prices.
(c) Includes the results of NBCU (our formerly consolidated subsidiary) and our former equity method investment in NBCUniversal LLC.
Revenues from customers located in the United States were $70,622 million, $68,617 million and $70,466 million in 2014,
2013 and 2012, respectively. Revenues from customers located outside the United States were $77,967 million, $77,428
million and $76,218 million in 2014, 2013 and 2012, respectively.
Property, plant and
Assets(a)(b) equipment additions(c) Depreciation and amortization
At December 31 For the years ended December 31 For the years ended December 31
(In millions) 2014 2013 2012 2014 2013 2012 2014 2013 2012
Power & Water $ 30,338 $ 29,494 $ 27,143 $ 622 $ 714 $ 661 $ 678 $ 668 $ 647
Oil & Gas 27,260 26,193 20,111 653 1,185 467 583 479 426
Energy Management 10,976 10,305 9,594 176 137 155 313 323 287
Aviation 33,716 32,273 25,145 1,197 1,178 781 824 677 644
Healthcare 29,227 27,858 28,369 405 316 322 843 861 879
Transportation 4,449 4,418 4,335 128 282 724 168 167 90
Appliances & Lighting 4,560 4,306 4,201 359 405 485 235 300 265
GE Capital 500,216 516,829 539,351 10,410 9,978 11,879 7,262 7,738 7,348
Corporate items
and eliminations(d) 7,607 4,884 26,750 (110) 194 (99) 166 260 218
Total $ 648,349 $ 656,560 $ 684,999 $ 13,840 $ 14,389 $ 15,375 $ 11,072 $ 11,473 $ 10,804
(a) Assets of discontinued operations, NBCU (our formerly consolidated subsidiary) and our former equity method investment in NBCUniversal LLC are included in
Corporate items and eliminations for all periods presented.
(b) Total assets of Power & Water, Oil & Gas, Energy Management, Aviation, Healthcare, Transportation, Appliances & Lighting and GE Capital operating segments at
December 31, 2014, include investment in and advances to associated companies of $357 million, $146 million, $824 million, $1,378 million, $511 million, $6 million, $57
million and $16,747 million, respectively. Investments in and advances to associated companies contributed approximately $(7) million, $20 million, $29 million, $94
million, $(33) million, an insignificant amount , $70 million and $1,182 million to segment pre-tax income of Power & Water, Oil & Gas, Energy Management, Aviation,
Healthcare, Transportation, Appliances & Lighting and GE Capital operating segments, respectively, for the year ended December 31, 2014. Aggregate summarized
financial information for significant associated companies assuming a 100% ownership interest at December 31, 2014 included: total assets of $93,624 million, primarily
financing receivables of $46,481 million; total liabilities of $64,872 million, primarily debt of $40,244 million; revenues totaled $46,087 million; and net loss totaled
$(1,295) million.
(c) Additions to property, plant and equipment include amounts relating to principal businesses purchased.
(d) Includes deferred income taxes that are presented as assets for purposes of our consolidating balance sheet presentation.