GE 2014 Annual Report Download - page 224
Download and view the complete annual report
Please find page 224 of the 2014 GE annual report below. You can navigate through the pages in the report by either clicking on the pages listed below, or by using the keyword search tool below to find specific information within the annual report.-
 1
1 -
2
-
3
-
4
-
5
-
6
-
7
-
8
-
9
-
10
-
11
-
12
-
13
-
14
-
15
-
16
-
17
-
18
-
19
-
20
-
21
-
22
-
23
-
24
-
25
-
26
-
27
-
28
-
29
-
30
-
31
-
32
-
33
-
34
-
35
-
36
-
37
-
38
-
39
-
40
-
41
-
42
-
43
-
44
-
45
-
46
-
47
-
48
-
49
-
50
-
51
-
52
-
53
-
54
-
55
-
56
-
57
-
58
-
59
-
60
-
61
-
62
-
63
-
64
-
65
-
66
-
67
-
68
-
69
-
70
-
71
-
72
-
73
-
74
-
75
-
76
-
77
-
78
-
79
-
80
-
81
-
82
-
83
-
84
-
85
-
86
-
87
-
88
-
89
-
90
-
91
-
92
-
93
-
94
-
95
-
96
-
97
-
98
-
99
-
100
-
101
-
102
-
103
-
104
-
105
-
106
-
107
-
108
-
109
-
110
-
111
-
112
-
113
-
114
-
115
-
116
-
117
-
118
-
119
-
120
-
121
-
122
-
123
-
124
-
125
-
126
-
127
-
128
-
129
-
130
-
131
-
132
-
133
-
134
-
135
-
136
-
137
-
138
-
139
-
140
-
141
-
142
-
143
-
144
-
145
-
146
-
147
-
148
-
149
-
150
-
151
-
152
-
153
-
154
-
155
-
156
-
157
-
158
-
159
-
160
-
161
-
162
-
163
-
164
-
165
-
166
-
167
-
168
-
169
-
170
-
171
-
172
-
173
-
174
-
175
-
176
-
177
-
178
-
179
-
180
-
181
-
182
-
183
-
184
-
185
-
186
-
187
-
188
-
189
-
190
-
191
-
192
-
193
-
194
-
195
-
196
-
197
-
198
-
199
-
200
-
201
-
202
-
203
-
204
-
205
-
206
-
207
-
208
-
209
-
210
-
211
-
212
-
213
-
 214
214 -
 215
215 -
 216
216 -
 217
217 -
 218
218 -
 219
219 -
 220
220 -
 221
221 -
 222
222 -
 223
223 -
 224
224 -
 225
225 -
 226
226 -
 227
227 -
 228
228 -
 229
229 -
 230
230 -
 231
231 -
 232
232 -
 233
233 -
 234
234 -
235
-
236
-
237
-
238
-
239
-
240
-
241
-
242
-
243
-
244
-
245
-
246
-
247
-
248
-
249
-
250
-
251
-
252
-
253
-
254
-
255
-
256
 |
 |

204 GE 2014 FORM 10-K
FINANCIAL STATEMENTS FINANCIAL INSTRUMENTS
FAIR VALUE HEDGES
We use interest rate and currency exchange derivatives to hedge the fair value effects of interest rate and currency exchange
rate changes on local and non-functional currency denominated fixed-rate debt. For relationships designated as fair value
hedges, changes in fair value of the derivatives are recorded in earnings within interest and other financial charges, along with
offsetting adjustments to the carrying amount of the hedged debt.
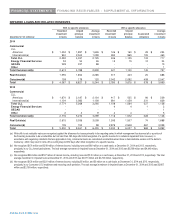
EARNINGS EFFECTS OF FAIR VALUE HEDGING RELATIONSHIPS
2014 2013
Gain (loss) Gain (loss) Gain (loss) Gain (loss)
on hedging on hedged on hedging on hedged
(In millions) derivatives items derivatives items
Interest rate contracts $ 3,898 $ (3,973) $ (5,258) $ 5,180
Currency exchange contracts (19) 17 (7) 6
Fair value hedges resulted in $(77) million and $(79) million of ineffectiveness in 2014 and 2013, respectively. In both 2014
and 2013, there were insignificant amounts excluded from the assessment of effectiveness.
CASH FLOW HEDGES
We use interest rate, currency exchange and commodity derivatives to reduce the variability of expected future cash flows
associated with variable rate borrowings and commercial purchase and sale transactions, including commodities. For
derivatives that are designated in a cash flow hedging relationship, the effective portion of the change in fair value of the
derivative is reported as a component of AOCI and reclassified into earnings contemporaneously and in the same caption with
the earnings effects of the hedged transaction.
Gain (loss) reclassified
Gain (loss) recognized in AOCI from AOCI into earnings
(In millions) 2014 2013 2014 2013
Interest rate contracts $ (1) $ (26) $ (234) $ (364)
Currency exchange contracts (541) 941 (641) 817
Commodity contracts (4) (6) (3) (5)
Total(a) $ (546) $ 909 $ (878) $ 448
(a) Gain (loss) is recorded in GECC revenues from services, interest and other financial charges, and other costs and expenses when reclassified to earnings.
The total pre-tax amount in AOCI related to cash flow hedges of forecasted transactions was a $213 million loss at December
31, 2014. We expect to transfer $212 million to earnings as an expense in the next 12 months contemporaneously with the
earnings effects of the related forecasted transactions. In both 2014 and 2013, we recognized insignificant gains and losses
related to hedged forecasted transactions and firm commitments that did not occur by the end of the originally specified period.
At December 31, 2014 and 2013, the maximum term of derivative instruments that hedge forecasted transactions was 18
years and 19 years, respectively. See Note15 for additional information about reclassifications out of AOCI.
For cash flow hedges, the amount of ineffectiveness in the hedging relationship and amount of the changes in fair value of the
derivatives that are not included in the measurement of ineffectiveness were insignificant for each reporting period.