GE 2014 Annual Report Download - page 200
Download and view the complete annual report
Please find page 200 of the 2014 GE annual report below. You can navigate through the pages in the report by either clicking on the pages listed below, or by using the keyword search tool below to find specific information within the annual report.-
 1
1 -
2
-
3
-
4
-
5
-
6
-
7
-
8
-
9
-
10
-
11
-
12
-
13
-
14
-
15
-
16
-
17
-
18
-
19
-
20
-
21
-
22
-
23
-
24
-
25
-
26
-
27
-
28
-
29
-
30
-
31
-
32
-
33
-
34
-
35
-
36
-
37
-
38
-
39
-
40
-
41
-
42
-
43
-
44
-
45
-
46
-
47
-
48
-
49
-
50
-
51
-
52
-
53
-
54
-
55
-
56
-
57
-
58
-
59
-
60
-
61
-
62
-
63
-
64
-
65
-
66
-
67
-
68
-
69
-
70
-
71
-
72
-
73
-
74
-
75
-
76
-
77
-
78
-
79
-
80
-
81
-
82
-
83
-
84
-
85
-
86
-
87
-
88
-
89
-
90
-
91
-
92
-
93
-
94
-
95
-
96
-
97
-
98
-
99
-
100
-
101
-
102
-
103
-
104
-
105
-
106
-
107
-
108
-
109
-
110
-
111
-
112
-
113
-
114
-
115
-
116
-
117
-
118
-
119
-
120
-
121
-
122
-
123
-
124
-
125
-
126
-
127
-
128
-
129
-
130
-
131
-
132
-
133
-
134
-
135
-
136
-
137
-
138
-
139
-
140
-
141
-
142
-
143
-
144
-
145
-
146
-
147
-
148
-
149
-
150
-
151
-
152
-
153
-
154
-
155
-
156
-
157
-
158
-
159
-
160
-
161
-
162
-
163
-
164
-
165
-
166
-
167
-
168
-
169
-
170
-
171
-
172
-
173
-
174
-
175
-
176
-
177
-
178
-
179
-
180
-
181
-
182
-
183
-
184
-
185
-
186
-
187
-
188
-
189
-
 190
190 -
 191
191 -
 192
192 -
 193
193 -
 194
194 -
 195
195 -
 196
196 -
 197
197 -
 198
198 -
 199
199 -
 200
200 -
 201
201 -
 202
202 -
 203
203 -
 204
204 -
 205
205 -
 206
206 -
 207
207 -
 208
208 -
 209
209 -
 210
210 -
211
-
212
-
213
-
214
-
215
-
216
-
217
-
218
-
219
-
220
-
221
-
222
-
223
-
224
-
225
-
226
-
227
-
228
-
229
-
230
-
231
-
232
-
233
-
234
-
235
-
236
-
237
-
238
-
239
-
240
-
241
-
242
-
243
-
244
-
245
-
246
-
247
-
248
-
249
-
250
-
251
-
252
-
253
-
254
-
255
-
256
 |
 |

180 GE 2014 FORM 10-K
FINANCIAL STATEMENTS POSTRETIREMENT BENEFIT PLANS
Plan fiduciaries set investment policies and strategies for the trust and oversee its investment allocation, which includes
selecting investment managers and setting long-term strategic targets. The primary strategic investment objectives are
balancing investment risk and return and monitoring the plan’s liquidity position in order to meet the near-term benefit payment
and other cash needs. Target allocation percentages are established at an asset class level by plan fiduciaries. Target
allocation ranges are guidelines, not limitations, and occasionally plan fiduciaries will approve allocations above or below a
target range.
Short-term securities purchased must generally be rated A-1/P-1 or better, except for 15% of such securities that may be rated
A-2/P-2 and other short-term securities as may be approved by the plan fiduciaries. According to statute, the aggregate
holdings of all qualifying employer securities (e.g., GE common stock) and qualifying employer real property may not exceed
10% of the fair value of trust assets at the time of purchase. GE securities represented 3.9% and 4.0% of trust assets at year-
end 2014 and 2013, respectively.
Retiree life plan assets were $813 million and $903 million at December 31, 2014 and 2013, respectively. Public equity and
debt securities amounting to $615 million and $727 million represented approximately 78% and 77% of total investments at
December 31, 2014 and 2013, respectively. The plans’ investments were classified as 37% Level 1, 41% Level 2 and 22%
Level 3 at December 31, 2014. The plans’ investments were classified as 33% Level 1, 43% Level 2 and 24% Level 3 at
December 31, 2013. The changes in Level 3 investments were insignificant for the years ended December 31, 2014 and 2013.
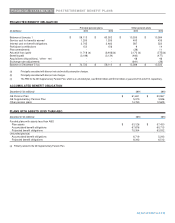
RETIREE BENEFIT ASSET(LIABILITY)
December 31 (In millions) 2014 2013
Funded status(a) $ (9,890) $ (9,010)
Liability recorded in the Statement of Financial Position
Retiree health plans
Due within one year $ (518) $ (531)
Due after one year (7,927) (7,095)
Retiree life plans (1,445) (1,384)
Net liability recognized $ (9,890) $ (9,010)
Amounts recorded in shareowners' equity (unamortized)
Prior service cost (credit) $ (24) $ 963
Net actuarial gain (71) (1,667)
Total $ (95) $ (704)
(a) Fair value of assets less APBO, as shown in the preceding tables.
In 2015, we estimate that we will amortize $125 million of prior service cost and $5 million of net actuarial loss from
shareowners’ equity into retiree benefit plans cost. Comparable amortized amounts in 2014 were $353 million of prior service
cost and $150 million of net actuarial gain.
ESTIMATED FUTURE BENEFIT PAYMENTS
2020 -
(In millions) 2015 2016 2017 2018 2019 2024
$ 680 $ 665 $ 670 $ 675 $ 685 $ 3,285