GE 2014 Annual Report Download - page 236
Download and view the complete annual report
Please find page 236 of the 2014 GE annual report below. You can navigate through the pages in the report by either clicking on the pages listed below, or by using the keyword search tool below to find specific information within the annual report.-
 1
1 -
2
-
3
-
4
-
5
-
6
-
7
-
8
-
9
-
10
-
11
-
12
-
13
-
14
-
15
-
16
-
17
-
18
-
19
-
20
-
21
-
22
-
23
-
24
-
25
-
26
-
27
-
28
-
29
-
30
-
31
-
32
-
33
-
34
-
35
-
36
-
37
-
38
-
39
-
40
-
41
-
42
-
43
-
44
-
45
-
46
-
47
-
48
-
49
-
50
-
51
-
52
-
53
-
54
-
55
-
56
-
57
-
58
-
59
-
60
-
61
-
62
-
63
-
64
-
65
-
66
-
67
-
68
-
69
-
70
-
71
-
72
-
73
-
74
-
75
-
76
-
77
-
78
-
79
-
80
-
81
-
82
-
83
-
84
-
85
-
86
-
87
-
88
-
89
-
90
-
91
-
92
-
93
-
94
-
95
-
96
-
97
-
98
-
99
-
100
-
101
-
102
-
103
-
104
-
105
-
106
-
107
-
108
-
109
-
110
-
111
-
112
-
113
-
114
-
115
-
116
-
117
-
118
-
119
-
120
-
121
-
122
-
123
-
124
-
125
-
126
-
127
-
128
-
129
-
130
-
131
-
132
-
133
-
134
-
135
-
136
-
137
-
138
-
139
-
140
-
141
-
142
-
143
-
144
-
145
-
146
-
147
-
148
-
149
-
150
-
151
-
152
-
153
-
154
-
155
-
156
-
157
-
158
-
159
-
160
-
161
-
162
-
163
-
164
-
165
-
166
-
167
-
168
-
169
-
170
-
171
-
172
-
173
-
174
-
175
-
176
-
177
-
178
-
179
-
180
-
181
-
182
-
183
-
184
-
185
-
186
-
187
-
188
-
189
-
190
-
191
-
192
-
193
-
194
-
195
-
196
-
197
-
198
-
199
-
200
-
201
-
202
-
203
-
204
-
205
-
206
-
207
-
208
-
209
-
210
-
211
-
212
-
213
-
214
-
215
-
216
-
217
-
218
-
219
-
220
-
221
-
222
-
223
-
224
-
225
-
 226
226 -
 227
227 -
 228
228 -
 229
229 -
 230
230 -
 231
231 -
 232
232 -
 233
233 -
 234
234 -
 235
235 -
 236
236 -
 237
237 -
 238
238 -
 239
239 -
 240
240 -
 241
241 -
 242
242 -
 243
243 -
 244
244 -
 245
245 -
 246
246 -
247
-
248
-
249
-
250
-
251
-
252
-
253
-
254
-
255
-
256
 |
 |

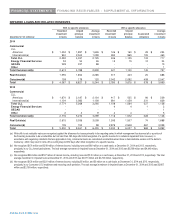
216 GE 2014 FORM 10-K
FINANCIAL STATEMENTS FINANCING RECEIVABLES – SUPPLEMENTAL INFORMATION
Impaired loans classified as TDRs in our CLL business were $1,869 million and $2,961 million at December 31, 2014 and
2013, respectively, and were primarily attributable to CLL Americas ($1,031 million and $1,770 million, respectively). At
December 31, 2014, we modified $926 million of loans classified as TDRs, primarily in CLL Americas ($515 million). Changes
to these loans primarily included extensions, interest only payment periods, debt to equity exchange and forbearance or other
actions, which are in addition to, or sometimes in lieu of, fees and rate increases. Of our $926 million and $1,509 million of
modifications classified as TDRs at December 31, 2014 and 2013, respectively, $36 million and $71 million have subsequently
experienced a payment default at December 31, 2014 and 2013, respectively.
Real Estate TDRs decreased from $3,625 million at December 31, 2013 to $1,757 million at December 31, 2014, primarily
driven by resolution of TDRs through paydowns. For borrowers with demonstrated operating capabilities, we work to
restructure loans when the cash flow and projected value of the underlying collateral support repayment over the modified
term. We deem loan modifications to be TDRs when we have granted a concession to a borrower experiencing financial
difficulty and we do not receive adequate compensation in the form of an effective interest rate that is at current market rates
of interest given the risk characteristics of the loan or other consideration that compensates us for the value of the concession.
The limited liquidity and higher return requirements in the real estate market for loans with higher loan-to-value (LTV) ratios
has typically resulted in the conclusion that the modified terms are not at current market rates of interest, even if the modified
loans are expected to be fully recoverable. For the year ended December 31, 2014, we modified $672 million of loans
classified as TDRs. Changes to these loans primarily included forbearance, maturity extensions and changes to collateral or
covenant terms or other actions, which are in addition to, or sometimes in lieu of, fees and rate increases. We received the
same or additional compensation in the form of rate increases and fees for the majority of these TDRs. Of our $672 million and
$1,595 million of modifications classified as TDRs during 2014 and 2013, respectively, $252 million and $197 million have
subsequently experienced a payment default in 2014 and 2013, respectively.
The substantial majority of the Real Estate TDRs have reserves determined based upon collateral value. Our specific reserves
on Real Estate TDRs were $25 million and $70 million and were 1.4% and 1.9%, of Real Estate TDRs, respectively, at
December 31, 2014 and 2013. In many situations these loans did not require a specific reserve as collateral value adequately
covered our recorded investment in the loan. While these modified loans had adequate collateral coverage, we were still
required to complete our TDR classification evaluation on each of the modifications without regard to collateral adequacy.
Impaired loans in our Consumer business represent restructured smaller balance homogeneous loans meeting the definition
of a TDR, and are therefore subject to the disclosure requirement for impaired loans, and commercial loans in our Consumer–
Other portfolio. The recorded investment of these impaired loans totaled $2,180 million (with an unpaid principal balance of
$2,271 million) and comprised $138 million with no specific allowance, primarily all in our Consumer–Other portfolio, and
$2,042 million with a specific allowance of $408 million at December 31, 2014. The impaired loans with a specific allowance
included $70 million with a specific allowance of $7 million in our Consumer–Other portfolio and $1,972 million with a specific
allowance of $401 million across the remaining Consumer business and had an unpaid principal balance and average
investment of $2,092 million and $2,547 million, respectively, at December 31, 2014.