GE 2014 Annual Report Download - page 179
Download and view the complete annual report
Please find page 179 of the 2014 GE annual report below. You can navigate through the pages in the report by either clicking on the pages listed below, or by using the keyword search tool below to find specific information within the annual report.-
 1
1 -
2
-
3
-
4
-
5
-
6
-
7
-
8
-
9
-
10
-
11
-
12
-
13
-
14
-
15
-
16
-
17
-
18
-
19
-
20
-
21
-
22
-
23
-
24
-
25
-
26
-
27
-
28
-
29
-
30
-
31
-
32
-
33
-
34
-
35
-
36
-
37
-
38
-
39
-
40
-
41
-
42
-
43
-
44
-
45
-
46
-
47
-
48
-
49
-
50
-
51
-
52
-
53
-
54
-
55
-
56
-
57
-
58
-
59
-
60
-
61
-
62
-
63
-
64
-
65
-
66
-
67
-
68
-
69
-
70
-
71
-
72
-
73
-
74
-
75
-
76
-
77
-
78
-
79
-
80
-
81
-
82
-
83
-
84
-
85
-
86
-
87
-
88
-
89
-
90
-
91
-
92
-
93
-
94
-
95
-
96
-
97
-
98
-
99
-
100
-
101
-
102
-
103
-
104
-
105
-
106
-
107
-
108
-
109
-
110
-
111
-
112
-
113
-
114
-
115
-
116
-
117
-
118
-
119
-
120
-
121
-
122
-
123
-
124
-
125
-
126
-
127
-
128
-
129
-
130
-
131
-
132
-
133
-
134
-
135
-
136
-
137
-
138
-
139
-
140
-
141
-
142
-
143
-
144
-
145
-
146
-
147
-
148
-
149
-
150
-
151
-
152
-
153
-
154
-
155
-
156
-
157
-
158
-
159
-
160
-
161
-
162
-
163
-
164
-
165
-
166
-
167
-
168
-
 169
169 -
 170
170 -
 171
171 -
 172
172 -
 173
173 -
 174
174 -
 175
175 -
 176
176 -
 177
177 -
 178
178 -
 179
179 -
 180
180 -
 181
181 -
 182
182 -
 183
183 -
 184
184 -
 185
185 -
 186
186 -
 187
187 -
 188
188 -
 189
189 -
190
-
191
-
192
-
193
-
194
-
195
-
196
-
197
-
198
-
199
-
200
-
201
-
202
-
203
-
204
-
205
-
206
-
207
-
208
-
209
-
210
-
211
-
212
-
213
-
214
-
215
-
216
-
217
-
218
-
219
-
220
-
221
-
222
-
223
-
224
-
225
-
226
-
227
-
228
-
229
-
230
-
231
-
232
-
233
-
234
-
235
-
236
-
237
-
238
-
239
-
240
-
241
-
242
-
243
-
244
-
245
-
246
-
247
-
248
-
249
-
250
-
251
-
252
-
253
-
254
-
255
-
256
 |
 |

GE 2014 FORM 10-K 159
FINANCIAL STATEMENTS FINANCING RECEIVABLES
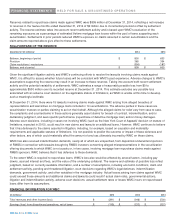
NOTE 6. GECC FINANCING RECEIVABLES AND ALLOWANCE FOR LOSSES ON
FINANCING RECEIVABLES
FINANCING RECEIVABLES
,
NET
December 31 (In millions) 2014 2013
Loans, net of deferred income $ 217,614 $ 231,268
Investment in financin
g
leases, net of deferred income 24,479 26,939
242
,
093 258
,
207
Allowance for losses
(
5,075
)
(
5,178
)
Financin
g
receivables – net
(
a
)
$ 237
,
018 $ 253
,
029
(a) Financing receivables at December 31, 2014 and 2013 included $264 million and $544 million, respectively, relating to loans that had been acquired in a transfer but
have been subject to credit deterioration since origination.
GECC financing receivables include both loans and financing leases. Loans represent transactions in a variety of forms,
including revolving charge and credit, mortgages, installment loans, intermediate-term loans and revolving loans secured by
business assets. The portfolio includes loans carried at the principal amount on which finance charges are billed periodically,
and loans carried at gross book value, which includes finance charges.
Investment in financing leases consists of direct financing and leveraged leases of aircraft, railroad rolling stock, autos, other
transportation equipment, data processing equipment, medical equipment, commercial real estate and other manufacturing,
power generation, and commercial equipment and facilities.
For federal income tax purposes, the leveraged leases and the majority of the direct financing leases are leases in which
GECC depreciates the leased assets and is taxed upon the accrual of rental income. Certain direct financing leases are loans
for federal income tax purposes. For these transactions, GECC is taxed only on the portion of each payment that constitutes
interest, unless the interest is tax-exempt (e.g., certain obligations of state governments).
Investment in direct financing and leveraged leases represents net unpaid rentals and estimated unguaranteed residual values
of leased equipment, less related deferred income. GECC has no general obligation for principal and interest on notes and
other instruments representing third-party participation related to leveraged leases; such notes and other instruments have not
been included in liabilities but have been offset against the related rentals receivable. The GECC share of rentals receivable
on leveraged leases is subordinate to the share of other participants who also have security interests in the leased equipment.
For federal income tax purposes, GECC is entitled to deduct the interest expense accruing on non-recourse financing related
to leveraged leases.
NET INVESTMENT IN FINANCING LEASES
Total financing leases Direct financing leases(a) Leveraged leases(b)
December 31
(
In millions
)
2014 20132014 2013 2014 2013
Total minimum lease
p
a
y
ments receivable $ 26,701 $ 29,970 $ 22,133 $ 24,571 $ 4,568 $ 5,399
Less
p
rinci
p
al and interest on third-
p
art
y
non-recourse debt
(
2,812
)
(
3,480
)
- -
(
2,812
)
(
3,480
)
Net rentals receivables 23
,
889 26
,
490 22
,
133 24
,
571 1
,
756 1
,
919
Estimated un
g
uaranteed residual value
of leased assets 4,268 5,073 2,529 3,067 1,739 2,006
Less deferred income
(
3,678
)
(
4,624
)
(
2,759
)
(
3,560
)
(
919
)
(
1,064
)
Investment in financin
g
leases
,
net of
deferred income 24,479 26,939 21,903 24,078 2,576 2,861
Less amounts to arrive at net investment
Allowance for losses
(
181
)
(
202
)
(
166
)
(
192
)
(
15
)
(
10
)
Deferred taxes
(
4,046
)
(
4,075
)
(
2,250
)
(
1,783
)
(
1,796
)
(
2,292
)
Net investment in financin
g
leases $ 20
,
252 $ 22
,
662 $ 19
,
487 $ 22
,
103 $ 765 $ 559
(a) Included $284 million and $317 million of initial direct costs on direct financing leases at December 31, 2014 and 2013, respectively.
(b) Included pre-tax income of $112 million and $31 million and income tax of $43 million and $11 million during 2014 and 2013, respectively. Net investment credits
recognized on leveraged leases during 2014 and 2013 were insignificant.