GE 2014 Annual Report Download - page 192
Download and view the complete annual report
Please find page 192 of the 2014 GE annual report below. You can navigate through the pages in the report by either clicking on the pages listed below, or by using the keyword search tool below to find specific information within the annual report.-
 1
1 -
2
-
3
-
4
-
5
-
6
-
7
-
8
-
9
-
10
-
11
-
12
-
13
-
14
-
15
-
16
-
17
-
18
-
19
-
20
-
21
-
22
-
23
-
24
-
25
-
26
-
27
-
28
-
29
-
30
-
31
-
32
-
33
-
34
-
35
-
36
-
37
-
38
-
39
-
40
-
41
-
42
-
43
-
44
-
45
-
46
-
47
-
48
-
49
-
50
-
51
-
52
-
53
-
54
-
55
-
56
-
57
-
58
-
59
-
60
-
61
-
62
-
63
-
64
-
65
-
66
-
67
-
68
-
69
-
70
-
71
-
72
-
73
-
74
-
75
-
76
-
77
-
78
-
79
-
80
-
81
-
82
-
83
-
84
-
85
-
86
-
87
-
88
-
89
-
90
-
91
-
92
-
93
-
94
-
95
-
96
-
97
-
98
-
99
-
100
-
101
-
102
-
103
-
104
-
105
-
106
-
107
-
108
-
109
-
110
-
111
-
112
-
113
-
114
-
115
-
116
-
117
-
118
-
119
-
120
-
121
-
122
-
123
-
124
-
125
-
126
-
127
-
128
-
129
-
130
-
131
-
132
-
133
-
134
-
135
-
136
-
137
-
138
-
139
-
140
-
141
-
142
-
143
-
144
-
145
-
146
-
147
-
148
-
149
-
150
-
151
-
152
-
153
-
154
-
155
-
156
-
157
-
158
-
159
-
160
-
161
-
162
-
163
-
164
-
165
-
166
-
167
-
168
-
169
-
170
-
171
-
172
-
173
-
174
-
175
-
176
-
177
-
178
-
179
-
180
-
181
-
 182
182 -
 183
183 -
 184
184 -
 185
185 -
 186
186 -
 187
187 -
 188
188 -
 189
189 -
 190
190 -
 191
191 -
 192
192 -
 193
193 -
 194
194 -
 195
195 -
 196
196 -
 197
197 -
 198
198 -
 199
199 -
 200
200 -
 201
201 -
 202
202 -
203
-
204
-
205
-
206
-
207
-
208
-
209
-
210
-
211
-
212
-
213
-
214
-
215
-
216
-
217
-
218
-
219
-
220
-
221
-
222
-
223
-
224
-
225
-
226
-
227
-
228
-
229
-
230
-
231
-
232
-
233
-
234
-
235
-
236
-
237
-
238
-
239
-
240
-
241
-
242
-
243
-
244
-
245
-
246
-
247
-
248
-
249
-
250
-
251
-
252
-
253
-
254
-
255
-
256
 |
 |

172 GE 2014 FORM 10-K
FINANCIAL STATEMENTS POSTRETIREMENT BENEFIT PLANS
ACTUARIAL ASSUMPTIONS
The actuarial assumptions at December 31 are used to measure the year-end benefit obligations and the pension costs for the
subsequent year.
Principal pension plans Other pension plans (weighted average)
December 31 2014 2013 2012 2011 2014 2013 2012 2011
Discount rate 4.02 % 4.85 % 3.96 % 4.21 % 3.53 % 4.39 % 3.92 % 4.42 %
Compensation increases 4.10 4.00 3.90 3.75 3.60 3.76 3.30 4.31
Expected return on assets 7.50 7.50 8.00 8.00 6.95 6.92 6.82 7.09
To determine the expected long-term rate of return on pension plan assets, we consider current and target asset allocations,
as well as historical and expected returns on various categories of plan assets. In developing future return expectations for our
principal pension plans' assets, we formulate views on the future economic environment, both in the U.S. and abroad. We
evaluate general market trends and historical relationships among a number of key variables that impact asset class returns
such as expected earnings growth, inflation, valuations, yields and spreads, using both internal and external sources. We also
take into account expected volatility by asset class and diversification across classes to determine expected overall portfolio
results given current and target allocations. Based on our analysis of future expectations of asset performance, past return
results, and our current and target asset allocations, we have assumed a 7.5% long-term expected return on those assets for
cost recognition in 2015. For the principal pension plans, we apply our expected rate of return to a market-related value of
assets, which stabilizes variability in the amounts to which we apply that expected return.
The Society of Actuaries recently issued new mortality tables projecting longer life expectancies that will result in higher
postretirement benefit obligations for U.S. companies. We updated our mortality assumptions at December 31, 2014. The new
mortality assumptions increased our principal pension plans’ benefit obligations by $3,953 million at December 31, 2014.
We amortize experience gains and losses, as well as the effects of changes in actuarial assumptions and plan provisions, over
a period no longer than the average future service of employees.
FUNDING POLICY
The funding policy for the GE Pension Plan is to contribute amounts sufficient to meet minimum funding requirements as set
forth in employee benefit and tax laws plus such additional amounts as we may determine to be appropriate. We did not make
contributions to the GE Pension Plan in 2014 and 2013. The ERISA minimum funding requirements do not require a
contribution in 2015. We expect to pay approximately $265 million for benefit payments under our GE Supplementary Pension
Plan and administrative expenses of our principal pension plans and expect to contribute approximately $540 million to other
pension plans in 2015. In 2014, comparative amounts were $236 million and $726 million, respectively.
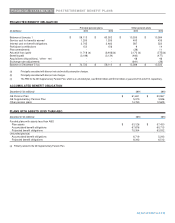
BENEFIT OBLIGATIONS
Benefit obligations are described in the following tables. Accumulated and projected benefit obligations (ABO and PBO)
represent the obligations of a pension plan for past service as of the measurement date. ABO is the present value of benefits
earned to date with benefits computed based on current compensation levels. PBO is ABO increased to reflect expected
future compensation.