GE 2014 Annual Report Download - page 196
Download and view the complete annual report
Please find page 196 of the 2014 GE annual report below. You can navigate through the pages in the report by either clicking on the pages listed below, or by using the keyword search tool below to find specific information within the annual report.-
 1
1 -
2
-
3
-
4
-
5
-
6
-
7
-
8
-
9
-
10
-
11
-
12
-
13
-
14
-
15
-
16
-
17
-
18
-
19
-
20
-
21
-
22
-
23
-
24
-
25
-
26
-
27
-
28
-
29
-
30
-
31
-
32
-
33
-
34
-
35
-
36
-
37
-
38
-
39
-
40
-
41
-
42
-
43
-
44
-
45
-
46
-
47
-
48
-
49
-
50
-
51
-
52
-
53
-
54
-
55
-
56
-
57
-
58
-
59
-
60
-
61
-
62
-
63
-
64
-
65
-
66
-
67
-
68
-
69
-
70
-
71
-
72
-
73
-
74
-
75
-
76
-
77
-
78
-
79
-
80
-
81
-
82
-
83
-
84
-
85
-
86
-
87
-
88
-
89
-
90
-
91
-
92
-
93
-
94
-
95
-
96
-
97
-
98
-
99
-
100
-
101
-
102
-
103
-
104
-
105
-
106
-
107
-
108
-
109
-
110
-
111
-
112
-
113
-
114
-
115
-
116
-
117
-
118
-
119
-
120
-
121
-
122
-
123
-
124
-
125
-
126
-
127
-
128
-
129
-
130
-
131
-
132
-
133
-
134
-
135
-
136
-
137
-
138
-
139
-
140
-
141
-
142
-
143
-
144
-
145
-
146
-
147
-
148
-
149
-
150
-
151
-
152
-
153
-
154
-
155
-
156
-
157
-
158
-
159
-
160
-
161
-
162
-
163
-
164
-
165
-
166
-
167
-
168
-
169
-
170
-
171
-
172
-
173
-
174
-
175
-
176
-
177
-
178
-
179
-
180
-
181
-
182
-
183
-
184
-
185
-
 186
186 -
 187
187 -
 188
188 -
 189
189 -
 190
190 -
 191
191 -
 192
192 -
 193
193 -
 194
194 -
 195
195 -
 196
196 -
 197
197 -
 198
198 -
 199
199 -
 200
200 -
 201
201 -
 202
202 -
 203
203 -
 204
204 -
 205
205 -
 206
206 -
207
-
208
-
209
-
210
-
211
-
212
-
213
-
214
-
215
-
216
-
217
-
218
-
219
-
220
-
221
-
222
-
223
-
224
-
225
-
226
-
227
-
228
-
229
-
230
-
231
-
232
-
233
-
234
-
235
-
236
-
237
-
238
-
239
-
240
-
241
-
242
-
243
-
244
-
245
-
246
-
247
-
248
-
249
-
250
-
251
-
252
-
253
-
254
-
255
-
256
 |
 |

176 GE 2014 FORM 10-K
FINANCIAL STATEMENTS POSTRETIREMENT BENEFIT PLANS
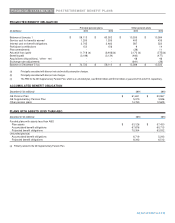
The following tables present the changes in Level 3 investments for the GE Pension Plan.
CHANGES IN LEVEL 3 INVESTMENTS FOR THE YEAR ENDED DECEMBER 31, 2014
Purchases, Transfers
issuances in and/o
r
January 1, Net realized Net unrealized and out o
f
December 31,
(In millions) 2014 gains (losses)(a) gains (losses) (a) settlements Level 3(b) 2014
Debt securities $ - $ (9) $ 11 $ 4 $ - $ 6
Private equities 6,269 592 (54) (1,565) (25) 5,217
Real estate 3,354 36 334 (595) - 3,129
Other investments 1,622 47 86 194 299 2,248
$ 11,245 $ 666 $ 377 $ (1,962) $ 274 $ 10,600
(a) The realized/unrealized gains (losses) include $899 million related to assets still held and $144 million for assets no longer held.
(b) Transfers in and out of Level 3 are considered to occur at the beginning of the period.
CHANGES IN LEVEL 3 INVESTMENTS FOR THE YEAR ENDED DECEMBER 31
,
2013
Purchases, Transfers
issuances in and/o
r
January 1, Net realized Net unrealized and out o
f
December 31,
(In millions) 2013 gains (losses)(a) gains (losses) (a) settlements Level 3 (b) 2013
Debt securities $ 75 $ (7) $ - $ (65) $ (3) $ -
Private equities 6,878 525 588 (1,675) (47) 6,269
Real estate 3,356 23 330 (355) - 3,354
Other investments 1,694 (1) 200 (77) (194) 1,622
$ 12,003 $ 540 $ 1,118 $ (2,172) $ (244) $ 11,245
(a) The realized/unrealized gains (losses) include $1,616 million related to assets still held and $42 million for assets no longer held.
(b) Transfers in and out of Level 3 are considered to occur at the beginning of the period.
Other pension plans’ assets were $12,386 million and $11,059 million at December 31, 2014 and 2013, respectively. Public
equity and debt securities amounting to $10,578 million and $9,781 million represented approximately 86% and 89% of total
investments at December 31, 2014 and 2013, respectively. The plans’ investments were classified as 9% Level 1, 77% Level
2 and 14% Level 3 at December 31, 2014. The plans’ investments were classified as 11% Level 1, 78% Level 2 and 11%
Level 3 at December 31, 2013. The changes in Level 3 investments between the years ended December 31, 2014 and 2013
were primarily due to investments in hedge funds and real estate. Other changes in Level 3 investments were insignificant for
the years ended December 31, 2014 and 2013.