GE 2014 Annual Report Download - page 199
Download and view the complete annual report
Please find page 199 of the 2014 GE annual report below. You can navigate through the pages in the report by either clicking on the pages listed below, or by using the keyword search tool below to find specific information within the annual report.-
 1
1 -
2
-
3
-
4
-
5
-
6
-
7
-
8
-
9
-
10
-
11
-
12
-
13
-
14
-
15
-
16
-
17
-
18
-
19
-
20
-
21
-
22
-
23
-
24
-
25
-
26
-
27
-
28
-
29
-
30
-
31
-
32
-
33
-
34
-
35
-
36
-
37
-
38
-
39
-
40
-
41
-
42
-
43
-
44
-
45
-
46
-
47
-
48
-
49
-
50
-
51
-
52
-
53
-
54
-
55
-
56
-
57
-
58
-
59
-
60
-
61
-
62
-
63
-
64
-
65
-
66
-
67
-
68
-
69
-
70
-
71
-
72
-
73
-
74
-
75
-
76
-
77
-
78
-
79
-
80
-
81
-
82
-
83
-
84
-
85
-
86
-
87
-
88
-
89
-
90
-
91
-
92
-
93
-
94
-
95
-
96
-
97
-
98
-
99
-
100
-
101
-
102
-
103
-
104
-
105
-
106
-
107
-
108
-
109
-
110
-
111
-
112
-
113
-
114
-
115
-
116
-
117
-
118
-
119
-
120
-
121
-
122
-
123
-
124
-
125
-
126
-
127
-
128
-
129
-
130
-
131
-
132
-
133
-
134
-
135
-
136
-
137
-
138
-
139
-
140
-
141
-
142
-
143
-
144
-
145
-
146
-
147
-
148
-
149
-
150
-
151
-
152
-
153
-
154
-
155
-
156
-
157
-
158
-
159
-
160
-
161
-
162
-
163
-
164
-
165
-
166
-
167
-
168
-
169
-
170
-
171
-
172
-
173
-
174
-
175
-
176
-
177
-
178
-
179
-
180
-
181
-
182
-
183
-
184
-
185
-
186
-
187
-
188
-
 189
189 -
 190
190 -
 191
191 -
 192
192 -
 193
193 -
 194
194 -
 195
195 -
 196
196 -
 197
197 -
 198
198 -
 199
199 -
 200
200 -
 201
201 -
 202
202 -
 203
203 -
 204
204 -
 205
205 -
 206
206 -
 207
207 -
 208
208 -
 209
209 -
210
-
211
-
212
-
213
-
214
-
215
-
216
-
217
-
218
-
219
-
220
-
221
-
222
-
223
-
224
-
225
-
226
-
227
-
228
-
229
-
230
-
231
-
232
-
233
-
234
-
235
-
236
-
237
-
238
-
239
-
240
-
241
-
242
-
243
-
244
-
245
-
246
-
247
-
248
-
249
-
250
-
251
-
252
-
253
-
254
-
255
-
256
 |
 |

GE 2014 FORM 10-K 179
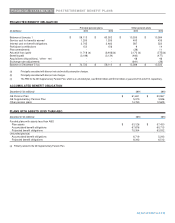
FINANCIAL STATEMENTS POSTRETIREMENT BENEFIT PLANS
Changes in the accumulated postretirement benefit obligation for retiree benefit plans follow.
ACCUMULATED POSTRETIREMENT BENEFIT OBLIGATION (APBO)
(In millions) 2014
2013
Balance at January 1 $ 9,913 $ 11,804
Service cost for benefits earned 164 229
Interest cost on benefit obligations 424 410
Participant contributions 52 52
Plan amendments (586) -
Actuarial loss (gain) 1,440 (a) (1,836)(b)
Benefits paid (704) (746)
Balance at December 31(c) $ 10,703 $ 9,913
(a) Primarily associated with discount rate and mortality assumption changes.
(b) Primarily associated with discount rate change and lower costs from new healthcare supplier contracts.
(c) The APBO for the retiree health plans was $8,445 million and $7,626 million at year-end 2014 and 2013, respectively.
A one percentage point change in the assumed healthcare cost trend rate would have the following effects.
1% 1%
(In millions) Increase
Decrease
APBO at December 31, 2014 $ 977 $ (810)
Service and interest cost in 2014 56 (47)
PLAN ASSETS
The fair value of the classes of retiree benefit plans' investments is presented below. The inputs and valuation techniques
used to measure the fair value of assets are consistently applied and described in Note 1.
FAIR VALUE OF PLAN ASSETS
(In millions) 2014 2013
Balance at January 1 $ 903 $ 946
Actual gain on plan assets 44 118
Employer contributions 518 533
Participant contributions 52 52
Benefits paid (704) (746)
Balance at December 31 $ 813 $ 903
ASSET ALLOCATION
2014 2014
Target Actual
December 31 allocation allocation
Equity securities(a) 35 - 75
%(b) 50%(c)
Debt securities (including cash equivalents) 11 - 46
26
Private equities 0 - 25
13
Real estate 0 - 12
9
Other investments(d) 0 - 10
2
(a) Includes investment funds that primarily hold this type of asset.
(b) Target allocations were 18-38% for U.S. equity securities and 17-37% for non-U.S. equity securities.
(c) Actual allocations were 29% for U.S. equity securities and 21% for non-U.S. equity securities.
(d) Substantially all represented hedge fund investments.