GE 2014 Annual Report Download - page 237
Download and view the complete annual report
Please find page 237 of the 2014 GE annual report below. You can navigate through the pages in the report by either clicking on the pages listed below, or by using the keyword search tool below to find specific information within the annual report.-
 1
1 -
2
-
3
-
4
-
5
-
6
-
7
-
8
-
9
-
10
-
11
-
12
-
13
-
14
-
15
-
16
-
17
-
18
-
19
-
20
-
21
-
22
-
23
-
24
-
25
-
26
-
27
-
28
-
29
-
30
-
31
-
32
-
33
-
34
-
35
-
36
-
37
-
38
-
39
-
40
-
41
-
42
-
43
-
44
-
45
-
46
-
47
-
48
-
49
-
50
-
51
-
52
-
53
-
54
-
55
-
56
-
57
-
58
-
59
-
60
-
61
-
62
-
63
-
64
-
65
-
66
-
67
-
68
-
69
-
70
-
71
-
72
-
73
-
74
-
75
-
76
-
77
-
78
-
79
-
80
-
81
-
82
-
83
-
84
-
85
-
86
-
87
-
88
-
89
-
90
-
91
-
92
-
93
-
94
-
95
-
96
-
97
-
98
-
99
-
100
-
101
-
102
-
103
-
104
-
105
-
106
-
107
-
108
-
109
-
110
-
111
-
112
-
113
-
114
-
115
-
116
-
117
-
118
-
119
-
120
-
121
-
122
-
123
-
124
-
125
-
126
-
127
-
128
-
129
-
130
-
131
-
132
-
133
-
134
-
135
-
136
-
137
-
138
-
139
-
140
-
141
-
142
-
143
-
144
-
145
-
146
-
147
-
148
-
149
-
150
-
151
-
152
-
153
-
154
-
155
-
156
-
157
-
158
-
159
-
160
-
161
-
162
-
163
-
164
-
165
-
166
-
167
-
168
-
169
-
170
-
171
-
172
-
173
-
174
-
175
-
176
-
177
-
178
-
179
-
180
-
181
-
182
-
183
-
184
-
185
-
186
-
187
-
188
-
189
-
190
-
191
-
192
-
193
-
194
-
195
-
196
-
197
-
198
-
199
-
200
-
201
-
202
-
203
-
204
-
205
-
206
-
207
-
208
-
209
-
210
-
211
-
212
-
213
-
214
-
215
-
216
-
217
-
218
-
219
-
220
-
221
-
222
-
223
-
224
-
225
-
226
-
 227
227 -
 228
228 -
 229
229 -
 230
230 -
 231
231 -
 232
232 -
 233
233 -
 234
234 -
 235
235 -
 236
236 -
 237
237 -
 238
238 -
 239
239 -
 240
240 -
 241
241 -
 242
242 -
 243
243 -
 244
244 -
 245
245 -
 246
246 -
 247
247 -
248
-
249
-
250
-
251
-
252
-
253
-
254
-
255
-
256
 |
 |

GE 2014 FORM 10-K 217
FINANCIAL STATEMENTS FINANCING RECEIVABLES – SUPPLEMENTAL INFORMATION
Impaired loans classified as TDRs in our Consumer business were $2,132 million and $2,874 million at December 31, 2014
and 2013, respectively. We utilize certain loan modification programs for borrowers experiencing financial difficulties in our
Consumer loan portfolio. These loan modification programs primarily include interest rate reductions and payment deferrals in
excess of three months, which were not part of the terms of the original contract, and are primarily concentrated in our non-
U.S. residential mortgage and U.S. credit card portfolios. For the year ended December 31, 2014, we modified $981 million of
consumer loans for borrowers experiencing financial difficulties, which are classified as TDRs, and included $506 million of
non-U.S. consumer loans, primarily residential mortgages, credit cards and personal loans and $475 million of U.S. consumer
loans, primarily credit cards. We expect borrowers whose loans have been modified under these programs to continue to be
able to meet their contractual obligations upon the conclusion of the modification. Of our $981 million and $1,441 million of
modifications classified as TDRs during 2014 and 2013, respectively, $102 million and $266 million have subsequently
experienced a payment default in 2014 and 2013, respectively.
We also utilize certain short-term (three months or less) loan modification programs for borrowers experiencing temporary
financial difficulties in our Consumer loan portfolio, which are not classified as TDRs. These loan modification programs are
primarily concentrated in our non-U.S. residential mortgage and non-U.S. installment and revolving portfolios. We sold our
U.S. residential mortgage business in 2007 and, as such, do not participate in the U.S. government-sponsored mortgage
modification programs. For the year ended December 31, 2014, we provided short-term modifications of $45 million of
consumer loans for borrowers experiencing financial difficulties, substantially all in our non-U.S. residential mortgage, credit
card and personal loan portfolios. For these modified loans, we provided insignificant interest rate reductions and payment
deferrals, which were not part of the terms of the original contract. We expect borrowers whose loans have been modified
under these short-term programs to continue to be able to meet their contractual obligations upon the conclusion of the short-
term modification.
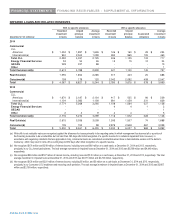
SUPPLEMENTAL CREDIT QUALITY INFORMATION
COMMERCIAL
Substantially all of our Commercial financing receivables portfolio is secured lending and we assess the overall quality of the
portfolio based on the potential risk of loss measure. The metric incorporates both the borrower’s credit quality along with any
related collateral protection.
Our internal risk ratings process is an important source of information in determining our allowance for losses and represents a
comprehensive approach to evaluate risk in our financing receivables portfolios. In deriving our internal risk ratings, we stratify
our Commercial portfolios into 21 categories of default risk and/or six categories of loss given default to group into three
categories: A, B and C. Our process starts by developing an internal risk rating for our borrowers, which is based upon our
proprietary models using data derived from borrower financial statements, agency ratings, payment history information, equity
prices and other commercial borrower characteristics. We then evaluate the potential risk of loss for the specific lending
transaction in the event of borrower default, which takes into account such factors as applicable collateral value, historical loss
and recovery rates for similar transactions, and our collection capabilities. Our internal risk ratings process and the models we
use are subject to regular monitoring and internal controls. The frequency of rating updates is set by our credit risk policy,
which requires annual Risk Committee approval.
As described above, financing receivables are assigned one of 21 risk ratings based on our process and then these are
grouped by similar characteristics into three categories in the table below. Category A is characterized by either high-credit-
quality borrowers or transactions with significant collateral coverage that substantially reduces or eliminates the risk of loss in
the event of borrower default. Category B is characterized by borrowers with weaker credit quality than those in Category A, or
transactions with moderately strong collateral coverage that minimizes but may not fully mitigate the risk of loss in the event of
default. Category C is characterized by borrowers with higher levels of default risk relative to our overall portfolio or
transactions where collateral coverage may not fully mitigate a loss in the event of default.