GE 2014 Annual Report Download - page 228
Download and view the complete annual report
Please find page 228 of the 2014 GE annual report below. You can navigate through the pages in the report by either clicking on the pages listed below, or by using the keyword search tool below to find specific information within the annual report.-
 1
1 -
2
-
3
-
4
-
5
-
6
-
7
-
8
-
9
-
10
-
11
-
12
-
13
-
14
-
15
-
16
-
17
-
18
-
19
-
20
-
21
-
22
-
23
-
24
-
25
-
26
-
27
-
28
-
29
-
30
-
31
-
32
-
33
-
34
-
35
-
36
-
37
-
38
-
39
-
40
-
41
-
42
-
43
-
44
-
45
-
46
-
47
-
48
-
49
-
50
-
51
-
52
-
53
-
54
-
55
-
56
-
57
-
58
-
59
-
60
-
61
-
62
-
63
-
64
-
65
-
66
-
67
-
68
-
69
-
70
-
71
-
72
-
73
-
74
-
75
-
76
-
77
-
78
-
79
-
80
-
81
-
82
-
83
-
84
-
85
-
86
-
87
-
88
-
89
-
90
-
91
-
92
-
93
-
94
-
95
-
96
-
97
-
98
-
99
-
100
-
101
-
102
-
103
-
104
-
105
-
106
-
107
-
108
-
109
-
110
-
111
-
112
-
113
-
114
-
115
-
116
-
117
-
118
-
119
-
120
-
121
-
122
-
123
-
124
-
125
-
126
-
127
-
128
-
129
-
130
-
131
-
132
-
133
-
134
-
135
-
136
-
137
-
138
-
139
-
140
-
141
-
142
-
143
-
144
-
145
-
146
-
147
-
148
-
149
-
150
-
151
-
152
-
153
-
154
-
155
-
156
-
157
-
158
-
159
-
160
-
161
-
162
-
163
-
164
-
165
-
166
-
167
-
168
-
169
-
170
-
171
-
172
-
173
-
174
-
175
-
176
-
177
-
178
-
179
-
180
-
181
-
182
-
183
-
184
-
185
-
186
-
187
-
188
-
189
-
190
-
191
-
192
-
193
-
194
-
195
-
196
-
197
-
198
-
199
-
200
-
201
-
202
-
203
-
204
-
205
-
206
-
207
-
208
-
209
-
210
-
211
-
212
-
213
-
214
-
215
-
216
-
217
-
 218
218 -
 219
219 -
 220
220 -
 221
221 -
 222
222 -
 223
223 -
 224
224 -
 225
225 -
 226
226 -
 227
227 -
 228
228 -
 229
229 -
 230
230 -
 231
231 -
 232
232 -
 233
233 -
 234
234 -
 235
235 -
 236
236 -
 237
237 -
 238
238 -
239
-
240
-
241
-
242
-
243
-
244
-
245
-
246
-
247
-
248
-
249
-
250
-
251
-
252
-
253
-
254
-
255
-
256
 |
 |

208 GE 2014 FORM 10-K
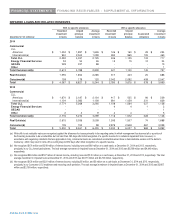
FINANCIAL STATEMENTS VARIABLE INTEREST ENTITIES
ASSETS AND LIABILITIES OF CONSOLIDATED VIEs
Consolidated Securitization Entities
Trade
(In millions) Trinity(a) Credit cards (b) Equipment (b) receivables Othe
r
Total
December 31, 2014
Assets(c)
Financing receivables, net $ - $ 25,645 $ 12,843 $ - $ 3,064 $ 41,552
Current receivables - - - 3,028
(d) 509 3,537
Investment securities 2,369 - - - 1,005 3,374
Other assets 17 1,059 766 2 2,814 4,658
Total $ 2,386 $ 26,704 $ 13,609 $ 3,030 $ 7,392 $ 53,121
Liabilities(c)
Borrowings $ - $ - $ - $ - $ 523 $ 523
Non-recourse borrowings - 14,967 10,359 2,692 646 28,664
Other liabilities 1,022 332 593 26 1,548 3,521
Total $ 1,022 $ 15,299 $ 10,952 $ 2,718 $ 2,717 $ 32,708
December 31, 2013
Assets(c)
Financing receivables, net $ - $ 24,766 $ 12,928 $ - $ 2,044 $ 39,738
Current receivables - - - 2,509 349 2,858
Investment securities 2,786 - - - 1,044 3,830
Other assets 213 20 557 - 2,081 2,871
Total $ 2,999 $ 24,786 $ 13,485 $ 2,509 $ 5,518 $ 49,297
Liabilities(c)
Borrowings $ - $ - $ - $ - $ 598 $ 598
Non-recourse borrowings - 15,363 10,982 2,180 49 28,574
Other liabilities 1,482 228 248 25 1,351 3,334
Total $ 1,482 $ 15,591 $ 11,230 $ 2,205 $ 1,998 $ 32,506
(a) Excluded intercompany advances from GECC to Trinity, which were eliminated in consolidation of $1,565 million and $1,837 million at December 31, 2014 and 2013,
respectively.
(b) We provide servicing to the CSEs and are contractually permitted to commingle cash collected from customers on financing receivables sold to CSE investors with our
own cash prior to payment to a CSE, provided our short-term credit rating does not fall below A-1/P-1. These CSEs also owe us amounts for purchased financial assets
and scheduled interest and principal payments. At December 31, 2014 and 2013, the amounts of commingled cash owed to the CSEs were $2,809 million and $6,314
million, respectively, and the amounts owed to us by CSEs were $2,913 million and $5,540 million, respectively.
(c) Asset amounts exclude intercompany receivables for cash collected on behalf of the entities by GECC as servicer, which are eliminated in consolidation. Such
receivables provide the cash to repay the entities’ liabilities. If these intercompany receivables were included in the table above, assets would be higher. In addition,
other assets, borrowings and other liabilities exclude intercompany balances that are eliminated in consolidation.
(d) Included $686 million of receivables originated by Appliances. We require third party debt holder consent to sell these assets. The receivables will be included in assets
of businesses held for sale when the consent is received.
Total revenues from our consolidated VIEs were $8,012 million, $7,540 million and $7,127 million in 2014, 2013 and 2012,
respectively. Related expenses consisted primarily of provisions for losses of $1,186 million, $1,247 million and $1,171 million
in 2014, 2013 and 2012, respectively, and interest and other financial charges of $358 million, $355 million and $541 million in
2014, 2013 and 2012, respectively. These amounts do not include intercompany revenues and costs, principally fees and
interest between GE and the VIEs, which are eliminated in consolidation.