McDonalds 2007 Annual Report Download - page 24
Download and view the complete annual report
Please find page 24 of the 2007 McDonalds annual report below. You can navigate through the pages in the report by either clicking on the pages listed below, or by using the keyword search tool below to find specific information within the annual report.-
 1
1 -
2
-
3
-
4
-
5
-
6
-
7
-
8
-
9
-
10
-
11
-
12
-
13
-
 14
14 -
 15
15 -
 16
16 -
 17
17 -
 18
18 -
 19
19 -
 20
20 -
 21
21 -
 22
22 -
 23
23 -
 24
24 -
 25
25 -
 26
26 -
 27
27 -
 28
28 -
 29
29 -
 30
30 -
 31
31 -
 32
32 -
 33
33 -
 34
34 -
35
-
36
-
37
-
38
-
39
-
40
-
41
-
42
-
43
-
44
-
45
-
46
-
47
-
48
-
49
-
50
-
51
-
52
-
53
-
54
-
55
-
56
-
57
-
58
-
59
-
60
-
61
-
62
-
63
-
64
-
65
-
66
-
67
-
68
 |
 |

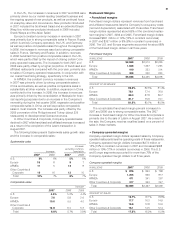
11-YEAR SUMMARY
DOLLARS IN MILLIONS,
EXCEPT PER SHARE DATA 2007 2006 2005 2004 2003 2002 2001 2000 1999 1998 1997
Company-operated sales $16,611 15,402 14,018 13,055 11,810 10,622 10,245 10,018 9,504 8,895 8,136
Franchised and affi liated
revenues $ 6,176 5,493 5,099 4,834 4,344 3,905 3,829 3,776 3,747 3,526 3,273
Total revenues $22,787 20,895 19,117 17,889 16,154 14,527 14,074 13,794 13,251 12,421 11,409
Operating income $ 3,879
(1)
4,433
(4)
3,984 3,554
(7)
2,835
(8)
2,116
(9)
2,708
(10)
3,344 3,324 2,762
(11)
2,808
Income from continuing
operations $ 2,335
(1,2)
2,866
(4)
2,578
(6)
2,287
(7)
1,510
(8)
994
(9)
1,642
(10)
1,981 1,950 1,550
(11)
1,642
Net income $ 2,395
(1,2,3)
3,544
(4,5)
2,602
(6)
2,279
(7)
1,471
(8,12)
893
(9,13)
1,637
(10)
1,977 1,948 1,550
(11)
1,642
Cash provided by operations $ 4,876 4,341 4,337 3,904 3,269 2,890 2,688 2,751 3,009 2,766 2,442
Cash used for investing
activities $ 1,150 1,274 1,818 1,383 1,370 2,467 2,068 2,213 2,262 1,948 2,217
Capital expenditures $ 1,947 1,742 1,607 1,419 1,307 2,004 1,906 1,945 1,868 1,879 2,111
Cash used for (provided by)
fi nancing activities $ 3,996 5,460 (442) 1,634 1,737 511 624 537 627 860 214
Treasury stock repurchased $ 3,949 3,719 1,228 605 439 687 1,090 2,002 933 1,162 765
Common stock cash
dividends $ 1,766 1,217 842 695 504 297 288 281 265 239 221
Financial position at
year end:
Total assets $29,392 28,974 29,989 27,838 25,838 24,194 22,535 21,684 20,983 19,784 18,242
Total debt $ 9,301 8,408 10,137 9,220 9,731 9,979 8,918 8,474 7,252 7,043 6,463
Total shareholders’ equity $15,280 15,458 15,146 14,201 11,982 10,281 9,488 9,204 9,639 9,465 8,852
Shares outstanding
IN MILLIONS
1,165 1,204 1,263 1,270 1,262 1,268 1,281 1,305 1,351 1,356 1,371
Per common share:
Income from continuing
operations–diluted $ 1.93
(1,2)
2.29
(4)
2.02
(6)
1.80
(7)
1.18
(8)
0.78
(9)
1.25
(10)
1.46 1.39 1.10
(11)
1.15
Net income–diluted $ 1.98
(1,2,3)
2.83
(4,5)
2.04
(6)
1.79
(7)
1.15
(8,12)
0.70
(9,13)
1.25
(10)
1.46 1.39 1.10
(11)
1.15
Dividends declared $ 1.50 1.00 .67 .55 .40 .24 .23 .22 .20 .18 .16
Market price at year end $ 58.91 44.33 33.72 32.06 24.83 16.08 26.47 34.00 40.31 38.41 23.88
Company-operated restaurants 6,906 8,166 8,173 8,179 8,030 8,115 7,547 6,841 6,022 5,433 4,887
Franchised restaurants 20,505 18,685 18,324 18,216 18,119 17,855 17,392 16,795 15,949 15,086 14,197
Affi liated restaurants 3,966 4,195 4,269 4,101 4,038 4,244 4,320 4,260 4,301 3,994 3,844
Total Systemwide
restaurants 31,377 31,046 30,766 30,496 30,187 30,214 29,259 27,896 26,272 24,513 22,928
Franchised and affi liated
sales
(14)
$46,943 41,380 38,913 37,052 33,129 30,022 29,590 29,714 28,979 27,084 25,502
(1) Includes pretax operating charges of $1.7 billion ($1.32 per share) related to impairment and other charges primarily as a result of the Company’s sale of its businesses in 18 Latin
American and Caribbean markets to a developmental licensee (see Latam transaction note to the consolidated fi nancial statements for further details).
(2) Includes a tax benefi t of $316.4 million ($0.26 per share) resulting from the completion of the Internal Revenue Service’s (IRS) examination of the Company’s 2003-2004 U.S.
federal tax returns.
(3) Includes income of $60.1 million ($0.05 per share) related to discontinued operations primarily from the sale of our investment in Boston Market.
(4) Includes pretax operating charges of $134 million ($98 million after tax or $0.08 per share) related to impairment and other charges (see Impairment and other charges
(credits), net note to the consolidated fi nancial statements for further details).
(5) Includes income of $678 million ($0.54 per share) related to discontinued operations primarily resulting from the disposal of our investment in Chipotle.
(6) Includes a net tax benefi t of $73 million ($0.05 per share) comprised of $179 million ($0.14 per share) of income tax benefi t resulting from the completion of an IRS
examination of the Company’s 2000-2002 U.S. tax returns, partly offset by $106 million ($0.09 per share) of incremental tax expense resulting from the decision to repatriate
certain foreign earnings under the Homeland Investment Act (HIA).
(7) Includes pretax operating charges of $130 million related to impairment and $121 million ($12 million related to 2004 and $109 million related to prior years) for a correction
in the Company’s lease accounting practices and policies, as well as a nonoperating gain of $49 million related to the sale of the Company’s interest in a U.S. real estate
partnership, for a total pretax expense of $202 million ($148 million after tax or $0.12 per share).
(8) Includes pretax operating charges of $408 million ($323 million after tax or $0.26 per share) primarily related to the disposition of certain non-McDonald’s brands
and impairment.
222