McDonalds 2007 Annual Report Download - page 33
Download and view the complete annual report
Please find page 33 of the 2007 McDonalds annual report below. You can navigate through the pages in the report by either clicking on the pages listed below, or by using the keyword search tool below to find specific information within the annual report.-
 1
1 -
2
-
3
-
4
-
5
-
6
-
7
-
8
-
9
-
10
-
11
-
12
-
13
-
14
-
15
-
16
-
17
-
18
-
19
-
20
-
21
-
22
-
 23
23 -
 24
24 -
 25
25 -
 26
26 -
 27
27 -
 28
28 -
 29
29 -
 30
30 -
 31
31 -
 32
32 -
 33
33 -
 34
34 -
 35
35 -
 36
36 -
 37
37 -
 38
38 -
 39
39 -
 40
40 -
 41
41 -
 42
42 -
 43
43 -
44
-
45
-
46
-
47
-
48
-
49
-
50
-
51
-
52
-
53
-
54
-
55
-
56
-
57
-
58
-
59
-
60
-
61
-
62
-
63
-
64
-
65
-
66
-
67
-
68
 |
 |

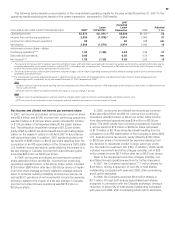
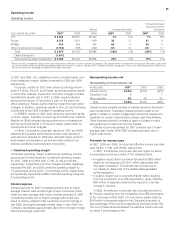
In the U.S., the increases in revenues in 2007 and 2006 were
primarily driven by our market-leading breakfast business and
the ongoing appeal of new products, as well as continued focus
on everyday value and convenience. New products introduced
in 2007 included the Southwest Salad and an extended Snack
Wrap line, while new products introduced in 2006 included
Snack Wraps and the Asian Salad.
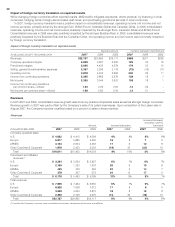
Europe’s constant currency increase in revenues in 2007
was primarily due to strong comparable sales in France, Russia
(which is entirely Company-operated), the U.K. and Germany,
as well as positive comparable sales throughout the segment.
In 2006, the increase in revenues was due to strong comparable
sales in France, Germany and Russia. In addition, revenues
in 2006 benefi ted from positive comparable sales in the U.K.,
which were partly offset by the impact of closing certain Com-
pany-operated restaurants. The increases for both 2007 and
2006 were partly offset by a higher proportion of franchised and
affi liated restaurants compared with the prior year, primarily due
to sales of Company-operated restaurants, in conjunction with
our overall franchising strategy, specifi cally in the U.K.
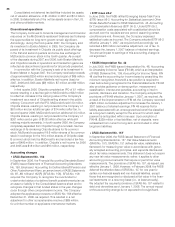
In APMEA, the constant currency increase in revenues
in 2007 was primarily driven by strong comparable sales in
China and Australia, as well as positive comparable sales in
substantially all other markets. In addition, expansion in China
contributed to the increase. In 2006, the increase in revenues
was primarily driven by the consolidation of Malaysia for fi nan-
cial reporting purposes due to an increase in the Company’s
ownership during the fi rst quarter 2006, expansion and positive
comparable sales in China, as well as positive comparable
sales in most markets. The increase was partly offset by the
2005 conversion of the Philippines and Turkey (about 325
restaurants) to developmental license structures.
In Other Countries & Corporate, Company-operated sales
declined in 2007 while franchised and affi liated revenues increased
as a result of the completion of the Latam transaction in
August 2007.
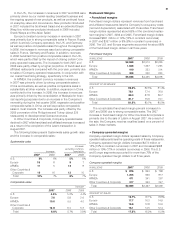
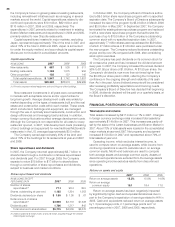
The following tables present Systemwide sales growth rates
and the increase in comparable sales:
Systemwide sales
Increase
excluding currency
Increase translation
2007 2006 2007 2006
U.S. 5% 6% 5% 6%
Europe 18 8 9 7
APMEA 17 5 13 8
Other Countries &
Corporate 19 16 12 10
Total 12% 7% 8% 7%
Comparable sales
Increase
2007 2006 2005
U.S. 4.5% 5.2% 4.4%
Europe 7.6 5.8 2.6
APMEA 10.6 5.5 4.0
Other Countries &
Corporate 10.8 9.4 5.3
Total 6.8% 5.7% 3.9%
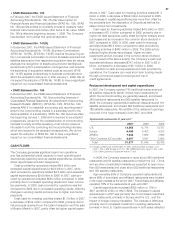
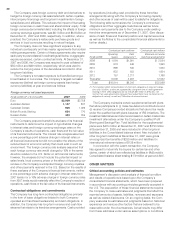
Restaurant Margins
• Franchised margins
Franchised margin dollars represent revenues from franchised
and affi liated restaurants less the Company’s occupancy costs
(rent and depreciation) associated with those sites. Franchised
margin dollars represented about 65% of the combined restau-
rant margins in 2007, 2006 and 2005. Franchised margin dollars
increased $601 million or 14% (10% in constant currencies)
in 2007 and $357 million or 9% (8% in constant currencies) in
2006. The U.S. and Europe segments accounted for about 85%
of the franchised margin dollars in all three years.
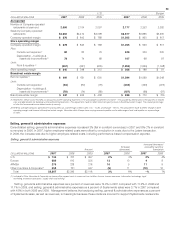
Franchised margins
IN MILLIONS
2007 2006 2005
U.S. $2,669 $2,513 $2,326
Europe 1,648 1,357 1,235
APMEA 410 333 314
Other Countries & Corporate 309 232 203
Total $5,036 $4,435 $4,078
PERCENT OF REVENUES
U.S. 82.8% 82.3% 81.4%
Europe 78.1 77.4 76.9
APMEA 88.3 87.8 86.7
Other Countries & Corporate 81.7 75.6 74.1
Total 81.5% 80.7% 80.0%
The consolidated franchised margin percent increased in
2007 and 2006 due to strong comparable sales. The 2007
increase in franchised margin for Other Countries & Corporate is
primarily due to the sale of Latam in August 2007. As a result of
the sale, the Company receives royalties based on a percent of
sales in these markets.
• Company-operated margins
Company-operated margin dollars represent sales by Company-
operated restaurants less the operating costs of these restaurants.
Company-operated margin dollars increased $372 million or
15% (10% in constant currencies) in 2007 and increased $398
million or 19% (17% in constant currencies) in 2006. The U.S.
and Europe segments accounted for more than 70% of the
Company-operated margin dollars in all three years.
Company-operated margins
IN MILLIONS
2007 2006 2005
U.S. $ 876 $ 843 $ 768
Europe 1,205 960 817
APMEA 471 341 267
Other Countries & Corporate 317 353 247
Total $2,869 $2,497 $2,099
PERCENT OF SALES
U.S. 18.7% 19.1% 18.8%
Europe 17.7 16.3 14.9
APMEA 15.0 12.8 10.9
Other Countries & Corporate 16.1 14.5 12.4
Total 17.3% 16.2% 15.0%
31