McDonalds 2007 Annual Report Download - page 25
Download and view the complete annual report
Please find page 25 of the 2007 McDonalds annual report below. You can navigate through the pages in the report by either clicking on the pages listed below, or by using the keyword search tool below to find specific information within the annual report.-
 1
1 -
2
-
3
-
4
-
5
-
6
-
7
-
8
-
9
-
10
-
11
-
12
-
13
-
14
-
 15
15 -
 16
16 -
 17
17 -
 18
18 -
 19
19 -
 20
20 -
 21
21 -
 22
22 -
 23
23 -
 24
24 -
 25
25 -
 26
26 -
 27
27 -
 28
28 -
 29
29 -
 30
30 -
 31
31 -
 32
32 -
 33
33 -
 34
34 -
 35
35 -
36
-
37
-
38
-
39
-
40
-
41
-
42
-
43
-
44
-
45
-
46
-
47
-
48
-
49
-
50
-
51
-
52
-
53
-
54
-
55
-
56
-
57
-
58
-
59
-
60
-
61
-
62
-
63
-
64
-
65
-
66
-
67
-
68
 |
 |

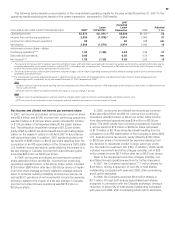
(9) Includes pretax operating charges of $853 million ($700 million after tax or $0.55 per share) primarily related to restructuring certain international markets and eliminating
positions, restaurant closings/asset impairment and the write-off of technology costs.
(10) Includes pretax operating charges of $378 million primarily related to the U.S. business reorganization and other global change initiatives, and restaurant closings/asset
impairment as well as net pretax nonoperating income of $125 million primarily related to a gain on the initial public offering of McDonald’s Japan, for a total pretax
expense of $253 million ($143 million after tax or $0.11 per share).
(11) Includes pretax operating charges of $322 million ($219 million after tax or $0.16 per share) consisting of $162 million of “Made For You” costs and $160 million related to a
home offi ce productivity initiative.
(12) Includes a $37 million after tax charge ($0.03 per share) to refl ect the cumulative effect of the adoption of Statement of Financial Accounting Standards (SFAS) No.143,
“Accounting for Asset Retirement Obligations,” which requires legal obligations associated with the retirement of long-lived assets to be recognized at their fair value at
the time the obligations are incurred.
(13) Includes a $99 million after tax charge ($0.07 per share) to refl ect the cumulative effect of the adoption of SFAS No.142, “Goodwill and Other Intangible Assets” (SFAS
No.142), which eliminates the amortization of goodwill and instead subjects it to annual impairment tests. Adjusted for the nonamortization provisions of SFAS No.142,
net income per common share would have been $0.02 higher in 2001 and 2000 and $0.01 higher in 1999 –1997.
(14) While franchised and affi liated sales are not recorded as revenues by the Company, management believes they are important in understanding the Company’s fi nancial
performance because these sales are the basis on which the Company calculates and records franchised and affi liated revenues and are indicative of the fi nancial health
of the franchisee base.
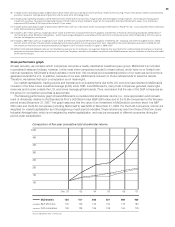
100
150
200
250
300
350
400
$450
Dec ’02 ’03 ’04 ’05 ’06 ’07
McDonald’s
S&P 500 Index
DJIA companies
100
100
100
157
129
128
206
143
135
221
150
138
298
173
164
406
183
178
Source: Standard & Poor’s Compustat
Stock performance graph
At least annually, we consider which companies comprise a readily identifi able investment peer group. McDonald’s is included
in published restaurant indices; however, unlike most other companies included in these indices, which have no or limited inter-
national operations, McDonald’s does business in more than 100 countries and a substantial portion of our revenues and income is
generated outside the U.S. In addition, because of our size, McDonald’s inclusion in those indices tends to skew the results.
Therefore, we believe that such a comparison is not meaningful.
Our market capitalization, trading volume and importance in an industry that is vital to the U.S. economy have resulted in McDonald’s
inclusion in the Dow Jones Industrial Average (DJIA) since 1985. Like McDonald’s, many DJIA companies generate meaningful
revenues and income outside the U.S. and some manage global brands. Thus, we believe that the use of the DJIA companies as
the group for comparison purposes is appropriate.
The following performance graph shows McDonald’s cumulative total shareholder returns (i.e., price appreciation and reinvest-
ment of dividends) relative to the Standard & Poor’s 500 Stock Index (S&P 500 Index) and to the DJIA companies for the fi ve-year
period ended December 31, 2007. The graph assumes that the value of an investment in McDonald’s common stock, the S&P
500 Index and the DJIA companies (including McDonald’s) was $100 at December 31, 2002. For the DJIA companies, returns are
weighted for market capitalization as of the beginning of each period indicated. These returns may vary from those of the Dow Jones
Industrial Average Index, which is not weighted by market capitalization, and may be composed of different companies during the
period under consideration.
Comparison of fi ve-year cumulative total shareholder returns
23