McDonalds 2007 Annual Report Download - page 57
Download and view the complete annual report
Please find page 57 of the 2007 McDonalds annual report below. You can navigate through the pages in the report by either clicking on the pages listed below, or by using the keyword search tool below to find specific information within the annual report.-
 1
1 -
2
-
3
-
4
-
5
-
6
-
7
-
8
-
9
-
10
-
11
-
12
-
13
-
14
-
15
-
16
-
17
-
18
-
19
-
20
-
21
-
22
-
23
-
24
-
25
-
26
-
27
-
28
-
29
-
30
-
31
-
32
-
33
-
34
-
35
-
36
-
37
-
38
-
39
-
40
-
41
-
42
-
43
-
44
-
45
-
46
-
 47
47 -
 48
48 -
 49
49 -
 50
50 -
 51
51 -
 52
52 -
 53
53 -
 54
54 -
 55
55 -
 56
56 -
 57
57 -
 58
58 -
 59
59 -
 60
60 -
 61
61 -
 62
62 -
 63
63 -
 64
64 -
 65
65 -
 66
66 -
 67
67 -
68
 |
 |

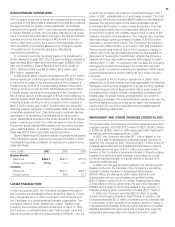
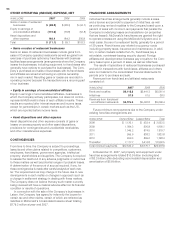
LEASING ARRANGEMENTS
At December 31, 2007, the Company was the lessee at 13,322
restaurant locations through ground leases (the Company leases
the land and the Company or franchisee owns the building)
and through improved leases (the Company leases land and
buildings). Lease terms for most restaurants are generally
for 20 years and, in many cases, provide for rent escalations
and renewal options, with certain leases providing purchase
options. Escalation terms vary by geographic segment with
examples including fi xed-rent escalations, escalations based on
an infl ation index, and fair-value market adjustments. The timing
of these escalations generally ranges from annually to every
fi ve years. For most locations, the Company is obligated for the
related occupancy costs including property taxes, insurance
and maintenance; however, for franchised sites, the Company
requires the franchisees to pay these costs. In addition, the
Company is the lessee under noncancelable leases covering
certain offi ces and vehicles.
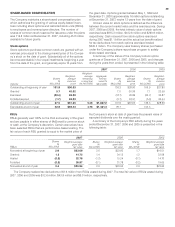
Future minimum payments required under existing operating
leases with initial terms of one year or more are:
IN MILLIONS
Restaurant Other Total
2008 $ 989.7 $ 64.1 $ 1,053.8
2009 918.2 55.4 973.6
2010 853.9 44.6 898.5
2011 786.8 35.2 822.0
2012 729.6 27.7 757.3
Thereafter 5,869.5 139.1 6,008.6
Total minimum payments $10,147.7 $366.1 $10,513.8
The following table provides detail of rent expense:
IN MILLIONS
2007 2006 2005
Company-operated restaurants:
U.S. $ 82.0 $ 81.6 $ 78.8
Outside the U.S. 533.9 515.1 483.9
Total 615.9 596.7 562.7
Franchised restaurants:
U.S. 358.4 340.2 320.1
Outside the U.S. 364.5 312.5 287.9
Total 722.9 652.7 608.0
Other 98.5 104.5 97.2
Total rent expense $1,437.3 $1,353.9 $1,267.9
Rent expense included percent rents in excess of minimum
rents (in millions) as follows–Company-operated restaurants:
2007–$118.3; 2006–$106.9; 2005–$95.7. Franchised restaurants:
2007–$136.1; 2006–$124.3; 2005–$112.5.
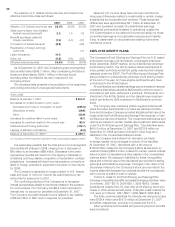
INCOME TAXES
Income from continuing operations before provision for
income taxes, classifi ed by source of income, was as follows:
IN MILLIONS
2007 2006 2005
U.S. $2,455.0 $2,126.2 $2,009.9
Outside the U.S. 1,117.1 2,028.2 1,650.3
Income from continuing operations
before provision for income taxes $3,572.1 $4,154.4 $3,660.2
The provision for income taxes, classifi ed by the timing and
location of payment, was as follows:
IN MILLIONS
2007 2006 2005
U.S. federal $ 480.8 $ 624.8 $ 591.3
U.S. state 84.9 107.4 99.1
Outside the U.S. 710.5 522.7 423.8
Current tax provision 1,276.2 1,254.9 1,114.2
U.S. federal (14.3) 55.7 (9.6)
U.S. state 10.0 10.8 (0.9)
Outside the U.S. (34.8) (33.1) (21.1)
Deferred tax provision (benefi t) (39.1) 33.4 (31.6)
Provision for income taxes $1,237.1 $1,288.3 $1,082.6
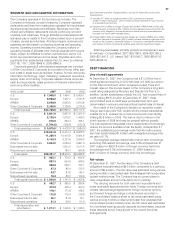
Net deferred tax liabilities consisted of:
IN MILLIONS
December 31,
2007 2006
Property and equipment $1,532.7 $1,500.2
Other 231.8 192.7
Total deferred tax liabilities 1,764.5 1,692.9
Property and equipment (370.5) (312.8)
Employee benefi t plans (292.8) (247.1)
Intangible assets (282.4) (255.1)
Capital loss carryforwards (228.3) (58.4)
Deferred foreign tax credits (127.2) (149.3)
Operating loss carryforwards (102.6) (92.9)
Indemnifi cation liabilities (62.7)
Other (295.8) (232.9)
Total deferred tax assets before
valuation allowance (1,762.3) (1,348.5)
Valuation allowance 385.1 181.0
Net deferred tax liabilities $ 387.3 $ 525.4
Balance sheet presentation:
Deferred income taxes $ 960.9 $ 1,076.3
Other assets–miscellaneous (502.8) (478.4)
Current assets–prepaid expenses
and other current assets (70.8) (72.5)
Net deferred tax liabilities $ 387.3 $ 525.4
55