McDonalds 2007 Annual Report Download - page 45
Download and view the complete annual report
Please find page 45 of the 2007 McDonalds annual report below. You can navigate through the pages in the report by either clicking on the pages listed below, or by using the keyword search tool below to find specific information within the annual report.-
 1
1 -
2
-
3
-
4
-
5
-
6
-
7
-
8
-
9
-
10
-
11
-
12
-
13
-
14
-
15
-
16
-
17
-
18
-
19
-
20
-
21
-
22
-
23
-
24
-
25
-
26
-
27
-
28
-
29
-
30
-
31
-
32
-
33
-
34
-
 35
35 -
 36
36 -
 37
37 -
 38
38 -
 39
39 -
 40
40 -
 41
41 -
 42
42 -
 43
43 -
 44
44 -
 45
45 -
 46
46 -
 47
47 -
 48
48 -
 49
49 -
 50
50 -
 51
51 -
 52
52 -
 53
53 -
 54
54 -
 55
55 -
56
-
57
-
58
-
59
-
60
-
61
-
62
-
63
-
64
-
65
-
66
-
67
-
68
 |
 |

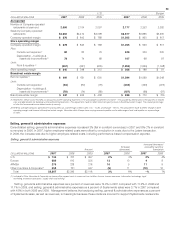
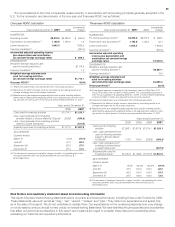
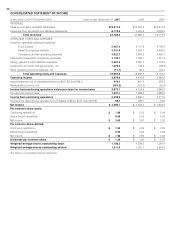
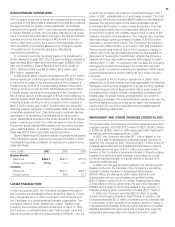
The reconciliations to the most comparable measurements, in accordance with accounting principles generally accepted in the
U.S., for the numerator and denominator of the one-year and three-year ROIIC are as follows:
Risk factors and cautionary statement about forward-looking information
This report includes forward-looking statements about our plans and future performance, including those under Outlook for 2008.
These statements use such words as “may,” “will,” “expect,” “believe” and “plan.” They refl ect our expectations and speak only
as of the date of this report. We do not undertake to update them. Our expectations (or the underlying assumptions) may change
or not be realized, and you should not rely unduly on forward-looking statements. We have identifi ed the principal risks and uncertainties
that affect our performance elsewhere in this report, and investors are urged to consider these risks and uncertainties when
evaluating our historical and expected performance.
One-year ROIIC calculation
Incremental
Years ended December 31, 2007 2006
change
NUMERATOR:
Operating income $3,879.0 $4,433.0 $ (554.0)
Depreciation and amortization
(1)
1,192.8 1,190.9 1.9
Latam transaction 1,665.3 1,665.3
Currency translation
(2)
(257.0)
Incremental adjusted operating income
plus depreciation and amortization
(at constant foreign exchange rates) $ 856.2
DENOMINATOR:
Weighted–average adjusted cash
used for investing activities
(3)
$1,714.9
Currency translation
(2)
1.2
Weighted–average adjusted cash
used for investing activities
(at constant foreign exchange rates) $1,716.1
One-year ROIIC
(4)
49.9%
(1) Represents depreciation and amortization from continuing operations.
(2) Represents the effect of foreign currency translation by translating results at an
average exchange rate for the periods measured.
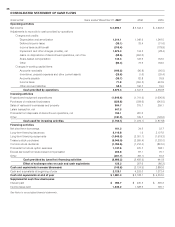
(3) Represents one-year weighted-average adjusted cash used for investing activities,
determined by applying the weightings below to the adjusted cash used for invest-
ing activities for each quarter in the two-year period ended December 31, 2007.
Years ended December 31,
2006 2007
Cash used for investing activities $1,274.1 $1,150.1
Less: Cash generated from investing
activities related to Boston Market & Chipotle (203.8) (184.3)
Less: Cash generated from investing activities
related to Latam transaction (647.5)
Adjusted cash used for investing activities $1,477.9 $1,981.9
AS A PERCENT
Quarters ended:
March 31 12.5% 87.5%
June 30 37.5 62.5
September 30 62.5 37.5
December 31 87.5 12.5
(4) The decrease in Impairment and other charges (credits), net excluding the Latam
transaction between 2007 and 2006 benefi ted the one-year ROIIC by 8.7
percentage points.
Three-year ROIIC calculation
Incremental
Years ended December 31,
2007 2004
change
NUMERATOR:
Pro forma operating income
(5)
$3,879.0 $3,312.5 $ 566.5
Depreciation and amortization
(6)
1,192.8 1,150.4 42.4
Latam transaction 1,665.3 1,665.3
Currency translation
(7)
(350.3)
Incremental adjusted operating
income plus depreciation and
amortization (at constant foreign
exchange rates) $1,923.9
DENOMINATOR:
Weighted–average adjusted cash
used for investing activities
(8)
$4,867.1
Currency translation
(7)
19.3
Weighted–average adjusted cash
used for investing activities
(at constant foreign exchange rates) $4,886.4
Three-year ROIIC
(9)
39.4%
(5) Share-based expense as reported in the Company’s year-end 2004 Form 10-K
was $149.5 million after tax ($241.2 million pretax). For comparability purposes to
2007 results subsequent to adopting SFAS No. 123(R), the 2004 reported operating
income of $3,553.7 million was adjusted for this pro forma expense.
(6) Represents depreciation and amortization from continuing operations.
(7) Represents the effect of foreign currency translation by translating results at an
average exchange rate for the periods measured.
(8) Represents three-year weighted-average adjusted cash used for investing activities,
determined by applying the weightings below to the adjusted cash used for invest-
ing activities for each quarter in the four-year period ended December 31, 2007.
Years ended December 31,
2004 2005 2006 2007
Cash used for investing
activities $1,383.1 $1,817.8 $1,274.1 $1,150.1
Less: Cash (generated from)
used for investing activities
related to Boston Market
& Chipotle 112.5 109.0 (203.8) (184.3)
Less: Cash generated from
investing activities related
to Latam transaction (647.5)
Adjusted cash used for
investing activities $1,270.6 $1,708.8 $1,477.9 $1,981.9
AS A PERCENT
Quarters ended:
March 31 12.5% 100.0% 100.0% 87.5%
June 30 37.5 100.0 100.0 62.5
September 30 62.5 100.0 100.0 37.5
December 31 87.5 100.0 100.0 12.5
(9) The decrease in Impairment and other charges (credits), net excluding the Latam
transaction between 2007 and 2004 benefi ted the three-year ROIIC by 5.3
percentage points.
43