McDonalds 2007 Annual Report Download - page 59
Download and view the complete annual report
Please find page 59 of the 2007 McDonalds annual report below. You can navigate through the pages in the report by either clicking on the pages listed below, or by using the keyword search tool below to find specific information within the annual report.-
 1
1 -
2
-
3
-
4
-
5
-
6
-
7
-
8
-
9
-
10
-
11
-
12
-
13
-
14
-
15
-
16
-
17
-
18
-
19
-
20
-
21
-
22
-
23
-
24
-
25
-
26
-
27
-
28
-
29
-
30
-
31
-
32
-
33
-
34
-
35
-
36
-
37
-
38
-
39
-
40
-
41
-
42
-
43
-
44
-
45
-
46
-
47
-
48
-
 49
49 -
 50
50 -
 51
51 -
 52
52 -
 53
53 -
 54
54 -
 55
55 -
 56
56 -
 57
57 -
 58
58 -
 59
59 -
 60
60 -
 61
61 -
 62
62 -
 63
63 -
 64
64 -
 65
65 -
 66
66 -
 67
67 -
 68
68
 |
 |

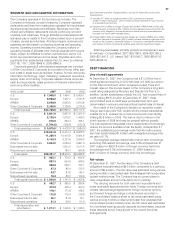
SEGMENT AND GEOGRAPHIC INFORMATION
The Company operates in the food service industry. The
Company’s revenues consist of sales by Company-operated
restaurants and fees from restaurants operated by franchisees/
developmental licensees and affi liates. Revenues from fran-
chised and affi liated restaurants include continuing rent and
royalties, and initial fees. Foreign affi liates and developmental
licensees pay a royalty to the Company based upon a percent
of sales, as well as initial fees. All intercompany revenues and
expenses are eliminated in computing revenues and operating
income. Operating income includes the Company’s share of
operating results of affi liates after interest expense and income
taxes, except for affi liates in certain markets such as the U.S.,
which are reported before income taxes. Royalties and other
payments from subsidiaries outside the U.S. were (in millions):
2007–$1,116.7, 2006–$945.4; 2005–$840.6.
Corporate general & administrative expenses are included
in Other Countries & Corporate and consist of home offi ce sup-
port costs in areas such as facilities, fi nance, human resources,
information technology, legal, marketing, restaurant operations,
supply chain and training. Corporate assets include corporate
cash and equivalents, asset portions of fi nancial instruments
and home offi ce facilities.
IN MILLIONS
2007 2006
2005
U.S. $ 7,905.5 $ 7,464.1 $ 6,955.1
Europe 8,926.2
7,637.7
7,071.8
APMEA 3,598.9 3,053.5 2,815.8
Other Countries & Corporate 2,356.0 2,739.9 2,274.6
Total revenues $22,786.6 $20,895.2 $19,117.3
U.S. $ 2,841.9 2,657.0 $ 2,421.6
Europe 2,125.4 1,610.2 1,449.3
APMEA 616.3 364.4 345.1
Other Countries & Corporate (1,704.6) (198.6) (232.0)
Total operating income $ 3,879.0
(1)
$ 4,433.0
(2)
$ 3,984.0
(3)
U.S. $10,031.8 $ 9,477.4 $ 8,968.3
Europe 11,380.4 10,413.9 9,424.6
APMEA 4,145.3 3,727.6 3,596.5
Other Countries & Corporate 3,834.2 3,529.4 5,891.0
Businesses held for sale 1,631.5 1,517.6
Discontinued operations 194.7 590.8
Total assets $29,391.7 $28,974.5 $29,988.8
U.S. $ 805.1 $ 774.3 $ 642.4
Europe 687.4 504.9 449.5
APMEA 302.8 208.1 197.1
Other Countries & Corporate 97.3 85.4 123.2
Businesses held for sale 43.7 87.0 84.7
Discontinued operations 10.3 82.2 109.9
Total capital expenditures $ 1,946.6 $ 1,741.9 $ 1,606.8
U.S. $ 402.7 $ 390.5 $ 385.8
Europe 473.3 436.4 427.5
APMEA 178.1 171.8 168.3
Other Countries & Corporate 112.6 110.4 129.9
Businesses held for sale 26.1 81.8 76.1
Discontinued operations 21.3 59.0 61.9
Total depreciation and
amortization $ 1,214.1 $ 1,249.9 $ 1,249.5
See Impairment and other charges/(credits), net note for further discussion of the
following items:
(1) Includes $1.7 billion of charges/(credits) (Other Countries & Corporate–
$1,681.0 million and Europe – ($10.7) million) primarily related to the sale of Latam
to a developmental licensee.
(2) Includes $134.2 million of charges (Europe–$61.9 million; APMEA–$48.2 million and
Other Countries & Corporate–$24.1 million) primarily related to losses incurred on the
transfers of the Company’s ownership interest in certain markets to developmental
licensees and certain other strategic actions.
(3) Includes ($28.4) million of charges/(credits) (Europe–$4.1 million; APMEA–($9.1) million
and Other Countries & Corporate–($23.4) million) primarily related to a gain due to the
transfer of the Company’s ownership interest in a market to a developmental licensee
and reversal of certain restructuring liabilities, partly offset by impairment charges.
Total long-lived assets, primarily property and equipment, were
(in millions)—Consolidated: 2007–$25,186.9; 2006–$23,185.3;
2005–$21,641.3. U.S. based: 2007–$10,043.7; 2006–$9,421.6;
2005–$9,001.9.
DEBT FINANCING
Line of credit agreements
At December 31, 2007, the Company had a $1.3 billion line of
credit agreement expiring in 2012 with fees of 0.05% per annum
on the total commitment, which remained unused. Fees and
interest rates on this line are based on the Company’s long-term
credit rating assigned by Moody’s and Standard & Poor’s. In
addition, certain subsidiaries outside the U.S. had unused lines of
credit totaling $970.4 million at December 31, 2007; these
uncommitted lines of credit were principally short-term and
denominated in various currencies at local market rates of interest.
As a result of the Company’s decision to repatriate certain
foreign earnings under HIA, certain wholly-owned subsidiaries
outside the U.S. entered into a multi-currency term loan facility
totaling $2.9 billion in 2005. The loan is due to mature in the
fourth quarter of 2008 and may be prepaid without penalty.
The loan agreement stipulates future repayments of borrowings
reduce the amount available under the facility. At December 31,
2007, the outstanding borrowings under the HIA multi-currency
term loan facility totaled $1.8 billion with a weighted-average inter-
est rate of 5.7%.
The weighted-average interest rate of short-term borrowings,
excluding HIA-related borrowings, was 5.9% at December 31,
2007 (based on $625.8 million of foreign currency bank line
borrowings) and 5.0% at December 31, 2006 (based on
$497.3 million of foreign currency bank line borrowings).
Fair values
At December 31, 2007, the fair value of the Company’s debt
obligations was estimated at $9.5 billion, compared to a carrying
amount of $9.3 billion. This fair value was estimated using various
pricing models or discounted cash fl ow analyses that incorporated
quoted market prices. The Company has no current plans to
retire a signifi cant amount of its debt prior to maturity.
The carrying amounts for both cash and equivalents and
notes receivable approximate fair value. Foreign currency and
interest rate exchange agreements, foreign currency options
and forward foreign exchange contracts were recorded in
the Consolidated balance sheet at fair value estimated using
various pricing models or discounted cash fl ow analyses that
incorporated quoted market prices. No fair value was estimated
for noninterest-bearing security deposits by franchisees, because
these deposits are an integral part of the overall franchise
arrangements.
57