McDonalds 2007 Annual Report Download - page 30
Download and view the complete annual report
Please find page 30 of the 2007 McDonalds annual report below. You can navigate through the pages in the report by either clicking on the pages listed below, or by using the keyword search tool below to find specific information within the annual report.-
 1
1 -
2
-
3
-
4
-
5
-
6
-
7
-
8
-
9
-
10
-
11
-
12
-
13
-
14
-
15
-
16
-
17
-
18
-
19
-
 20
20 -
 21
21 -
 22
22 -
 23
23 -
 24
24 -
 25
25 -
 26
26 -
 27
27 -
 28
28 -
 29
29 -
 30
30 -
 31
31 -
 32
32 -
 33
33 -
 34
34 -
 35
35 -
 36
36 -
 37
37 -
 38
38 -
 39
39 -
 40
40 -
41
-
42
-
43
-
44
-
45
-
46
-
47
-
48
-
49
-
50
-
51
-
52
-
53
-
54
-
55
-
56
-
57
-
58
-
59
-
60
-
61
-
62
-
63
-
64
-
65
-
66
-
67
-
68
 |
 |

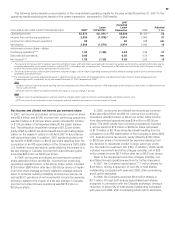
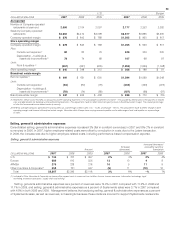
In addition to the consolidated operating results shown above, consolidated results for 2007 are presented in the following table,
excluding the impact of the Latam developmental license transaction. While the Company has previously converted certain other
markets to a developmental license structure, management believes the Latam transaction and the associated charge are not
indicative of ongoing operations due to the size and scope of the transaction. Management believes that the adjusted operating
results better refl ect the underlying business trends relevant to the periods presented.
CONSOLIDATED OPERATING RESULTS
Operating results
Revenues
Sales by Company-operated restaurants $16,611 8% $15,402 10% $14,018
Revenues from franchised and affi liated restaurants 6,176 12 5,493 8 5,099
Total revenues 22,787 9 20,895 9 19,117
Operating costs and expenses
Company-operated restaurant expenses 13,742 6 12,905 8 11,919
Franchised restaurants—occupancy expenses 1,140 8 1,058 4 1,021
Selling, general & administrative expenses 2,367 3 2,296 8 2,118
Impairment and other charges (credits), net 1,670 nm 134 nm (28)
Other operating (income) expense, net (11) nm 69 (33) 103
Total operating costs and expenses 18,908 15 16,462 9 15,133
Operating income 3,879 (12) 4,433 11 3,984
Interest expense 410 2 402 13 356
Nonoperating income, net (103) (16) (123) nm (32)
Income from continuing operations before provision
for income taxes 3,572 (14) 4,154 13 3,660
Provision for income taxes 1,237 (4) 1,288 19 1,082
Income from continuing operations 2,335 (19) 2,866 11 2,578
Income from discontinued operations (net of taxes
of $35, $102 and $17) 60 nm 678 nm 24
Net income $ 2,395 (32)% $ 3,544 36% $ 2,602
Income per common share—diluted
Continuing operations $ 1.93 (16)% $ 2.29 13% $ 2.02
Discontinued operations 0.05 nm 0.54 nm 0.02
Net income $ 1.98 (30)% $ 2.83 39% $ 2.04
Weighted-average common shares outstanding—diluted 1,211.8 1,251.7 1,274.2
nm Not meaningful.
2007 2006 2005
Increase/ Increase/
Amount (decrease) Amount (decrease) Amount
DOLLARS IN MILLIONS, EXCEPT PER SHARE DATA
28