McDonalds 2007 Annual Report Download - page 32
Download and view the complete annual report
Please find page 32 of the 2007 McDonalds annual report below. You can navigate through the pages in the report by either clicking on the pages listed below, or by using the keyword search tool below to find specific information within the annual report.-
 1
1 -
2
-
3
-
4
-
5
-
6
-
7
-
8
-
9
-
10
-
11
-
12
-
13
-
14
-
15
-
16
-
17
-
18
-
19
-
20
-
21
-
 22
22 -
 23
23 -
 24
24 -
 25
25 -
 26
26 -
 27
27 -
 28
28 -
 29
29 -
 30
30 -
 31
31 -
 32
32 -
 33
33 -
 34
34 -
 35
35 -
 36
36 -
 37
37 -
 38
38 -
 39
39 -
 40
40 -
 41
41 -
 42
42 -
43
-
44
-
45
-
46
-
47
-
48
-
49
-
50
-
51
-
52
-
53
-
54
-
55
-
56
-
57
-
58
-
59
-
60
-
61
-
62
-
63
-
64
-
65
-
66
-
67
-
68
 |
 |

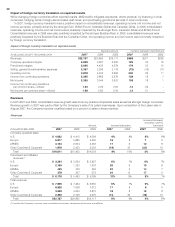
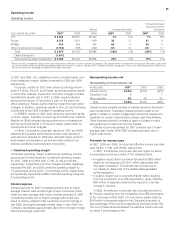
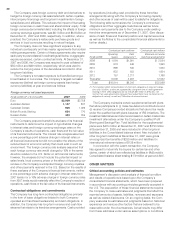
Impact of foreign currency translation on reported results
While changing foreign currencies affect reported results, McDonald’s mitigates exposures, where practical, by fi nancing in local
currencies, hedging certain foreign-denominated cash fl ows, and purchasing goods and services in local currencies.
In 2007, foreign currency translation had a positive impact on consolidated revenues, operating income, net income and net
income per share, primarily driven by the stronger Euro, British Pound, Australian Dollar and Canadian Dollar. In 2006, consolidated
revenues, operating income and net income were positively impacted by the stronger Euro, Canadian Dollar and British Pound.
Consolidated revenues in 2006 were also positively impacted by the stronger Brazilian Real. In 2005, consolidated revenues were
positively impacted by the Brazilian Real and the Canadian Dollar, but operating income and net income were minimally impacted
by foreign currency translation.
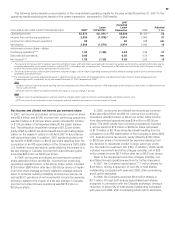
Revenues
In both 2007 and 2006, consolidated revenue growth was driven by positive comparable sales as well as stronger foreign currencies.
Revenue growth in 2007 was partly offset by the Company’s sale of its Latam businesses. Upon completion of the Latam sale in
August 2007, the Company receives royalties based on a percent of sales in these markets.
Revenues
Impact of foreign currency translation on reported results
Reported amount Currency translation benefi t/(cost)
IN MILLIONS, EXCEPT PER SHARE DATA
2007 2006 2005 2007 2006 2005
Revenues $22,787 $20,895 $19,117 $988 $271 $238
Company-operated margins 2,869 2,497 2,099 129 35 19
Franchised margins 5,036 4,435 4,078 179 23 15
Selling, general & administrative expenses 2,367 2,296 2,118 (73) (19) (17)
Operating income 3,879 4,433 3,984 230 29 11
Income from continuing operations 2,335 2,866 2,578 138 18 1
Net income 2,395 3,544 2,602 138 18 1
Income from continuing operations
per common share—diluted 1.93 2.29 2.02 .12 .02 –
Net income per common share—diluted 1.98 2.83 2.04 .12 .01 –
Increase/(decrease)
excluding currency
Amount Increase/(decrease) translation
DOLLARS IN MILLIONS
2007 2006 2005 2007 2006 2007 2006
Company-operated sales:
U.S. $ 4,682 $ 4,410 $ 4,098 6% 8% 6% 8%
Europe 6,817 5,885 5,465 16 8 7 6
APMEA 3,134 2,674 2,453 17 9 12 8
Other Countries & Corporate 1,978 2,433 2,002 (19) 22 (23) 16
Total $16,611 $15,402 $14,018 8% 10% 3% 8%
Franchised and affi liated
revenues:
(1)
U.S. $ 3,224 $ 3,054 $ 2,857 6% 7% 6% 7%
Europe 2,109 1,753 1,607 20 9 10 8
APMEA 465 379 362 22 5 14 7
Other Countries & Corporate 378 307 273 24 12 17 6
Total $ 6,176 $ 5,493 $ 5,099 12% 8% 8% 7%
Total revenues:
U.S. $ 7,906 $ 7,464 $ 6,955 6% 7% 6% 7%
Europe 8,926 7,638 7,072 17 8 8 6
APMEA 3,599 3,053 2,815 18 8 12 8
Other Countries & Corporate 2,356 2,740 2,275 (14) 20 (18) 15
Total $22,787 $20,895 $19,117 9% 9% 4% 8%
(1) Includes the Company’s revenues from conventional franchisees, developmental licensees and affi liates.
30