McDonalds 2007 Annual Report Download - page 34
Download and view the complete annual report
Please find page 34 of the 2007 McDonalds annual report below. You can navigate through the pages in the report by either clicking on the pages listed below, or by using the keyword search tool below to find specific information within the annual report.-
 1
1 -
2
-
3
-
4
-
5
-
6
-
7
-
8
-
9
-
10
-
11
-
12
-
13
-
14
-
15
-
16
-
17
-
18
-
19
-
20
-
21
-
22
-
23
-
 24
24 -
 25
25 -
 26
26 -
 27
27 -
 28
28 -
 29
29 -
 30
30 -
 31
31 -
 32
32 -
 33
33 -
 34
34 -
 35
35 -
 36
36 -
 37
37 -
 38
38 -
 39
39 -
 40
40 -
 41
41 -
 42
42 -
 43
43 -
 44
44 -
45
-
46
-
47
-
48
-
49
-
50
-
51
-
52
-
53
-
54
-
55
-
56
-
57
-
58
-
59
-
60
-
61
-
62
-
63
-
64
-
65
-
66
-
67
-
68
 |
 |
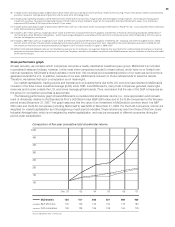
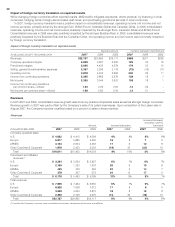
In the U.S., the Company-operated margin percent decreased
in 2007 due to cost pressures including higher commodity
and labor costs, partly offset by positive comparable sales. In
2006, the Company-operated margin percent increased due to
positive comparable sales, partly offset by higher labor costs,
commodity costs and utilities.
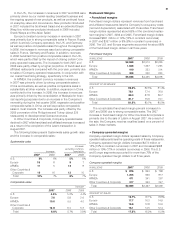
Europe’s Company-operated margin percent increased in
2007 primarily due to strong comparable sales, partly offset
by higher labor and commodity costs. In 2006, the Company-
operated margin percent increased due to strong comparable
sales, partly offset by higher labor costs. In addition, initiatives
in the U.K., such as the closing of certain underperforming
restaurants in the fi rst quarter 2006 and the sales of Company-
operated restaurants to franchisees and affi liates, contributed
to the increases in 2006, and to a lesser extent, 2007.
In APMEA, the Company-operated margin percent in 2007
increased due to strong comparable sales, partly offset by
higher labor costs. In both years, the Company-operated
margin percent refl ected improved results in China and many
other markets.
In Other Countries & Corporate, the Company-operated
margin in 2007 refl ected Latam operations through July 2007
and the benefi t due to the discontinuation of depreciation on
the assets in Latam from mid-April through July 2007.
• Supplemental information regarding Company-operated
restaurants
We continually review our restaurant ownership mix with a goal
of improving local relevance, profi ts and returns. In most cases,
franchising is the best way to achieve these goals. Although
direct restaurant operation is signifi cantly more capital-intensive
relative to franchising and results in lower restaurant margins
as a percent of revenues, Company-operated restaurants are
important to our success in both mature and developing markets.
In our Company-operated restaurants, we further develop and
refi ne operating standards, marketing concepts and product and
pricing strategies, so that only those that we believe are most
benefi cial are introduced Systemwide. In addition, we fi rmly
believe that operating restaurants is paramount to being a
credible franchisor and essential to providing Company personnel
with restaurant operations experience.
We report results for Company-operated restaurants based
on their sales, less costs directly incurred by that business
including occupancy costs. We report the results for franchised
restaurants based on franchised revenues, less associated
occupancy costs. For this reason and because we manage
our business based on geographic segments and not on the
basis of our ownership structure, we do not specifi cally allocate
selling, general & administrative expenses and other operating
(income) expenses to Company-operated or franchised restaurants.
Other operating items that relate to the Company-operated
restaurants generally include gains on sales of restaurant
businesses and write-offs of equipment and leasehold
improvements.
We believe the following information about Company-operated
restaurants in our most signifi cant markets provides an addi-
tional perspective on this business. Management responsible
for our Company-operated restaurants in these markets analyzes
the Company-operated business on this basis to assess its
performance. Management of the Company also considers
this information when evaluating our restaurant ownership mix,
subject to other relevant considerations.
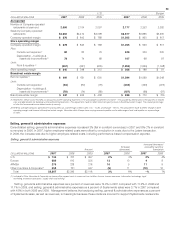
The following tables seek to illustrate the two components
of our Company-operated margins. The fi rst of these relates
exclusively to restaurant operations, which we refer to below as
“Store operating margin.” The second relates to the value of our
Brand and the real estate interest we retain for which we charge
rent and royalties. We refer to this component as “Brand/real
estate margin.” Both Company-operated and franchised restau-
rants are charged rent and royalties, although rent and royalties
for Company-operated restaurants are eliminated in consolida-
tion. Rent and royalties for both restaurant ownership types are
based on a percentage of sales, and the actual rent percentage
varies depending on the level of McDonald’s investment in the
restaurant. Royalties may also vary by market.
As shown in the following tables, in disaggregating the
components of our Company-operated margins, certain costs
with respect to Company-operated restaurants are refl ected in
Brand/real estate margin. Those costs consist of rent payable
by McDonald’s to third parties on leased sites and depreciation
for buildings and leasehold improvements and constitute a por-
tion of occupancy & other operating expenses recorded in the
Consolidated statement of income. Store operating margins
refl ect rent and royalty expenses, and those amounts are accounted
for as income in calculating Brand/real estate margin.
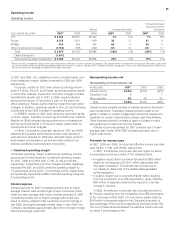
While we believe that the following information provides a
perspective in evaluating our Company-operated business,
it is not intended as a measure of our operating performance
or as an alternative to operating income or restaurant margins
as reported by the Company in accordance with accounting
principles generally accepted in the U.S. In particular, as noted
above, we do not allocate selling, general & administrative
expenses to our Company-operated business. An estimate of
costs to support this business was made by the U.S. and our
three major markets in Europe. We believe, on average, that a
range of $40,000 to $50,000 per restaurant is typical, but the
actual costs will vary depending on local circumstances and
the organizational structure of the market. These costs refl ect
the indirect services we believe are necessary to provide the
appropriate support of the restaurant.
32